

kubectl cnpg status, operator logs and a Grafana dashboard.
Where it lives
CloudNativePG stays under Resources; there is no new top-level navigation item. When thepostgresql.cnpg.io CRDs are discovered, the CloudNativePG group in the Resources sidebar gains a Views block above its resource kinds:
Clusters
The fleet: every cluster you can see, worst first. Needs attention narrows the list to clusters with a warning-or-worse problem on the Cluster, its instance Pods, the Jobs it runs, or an object that references it. Each row names its top problem in words, so you can tell an unschedulable first instance from a failing backup schedule without opening anything.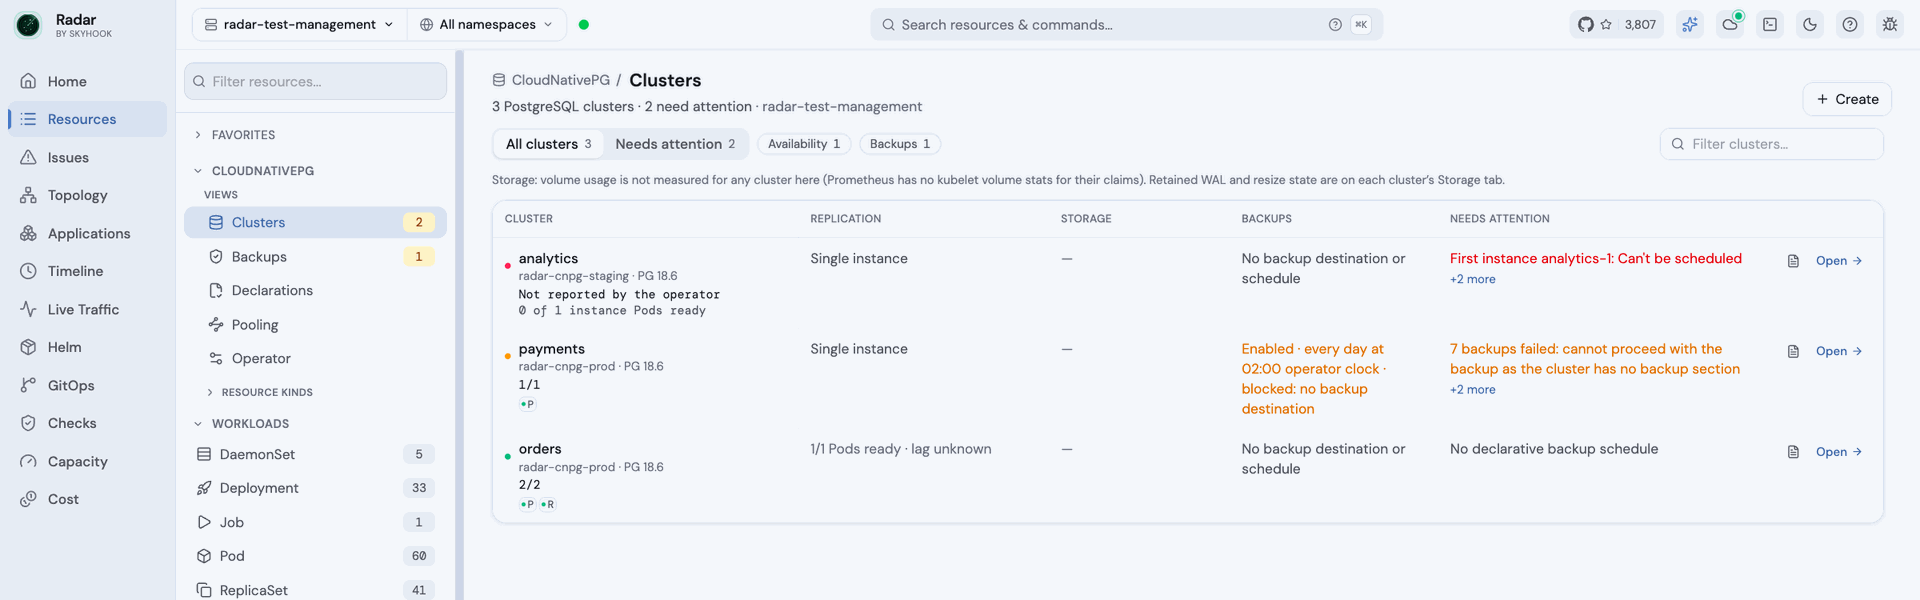
The fleet - two of three clusters need attention, each with its top problem
The Cluster page
Each cluster’s page is organized by task, and each tab is the one home of its facts: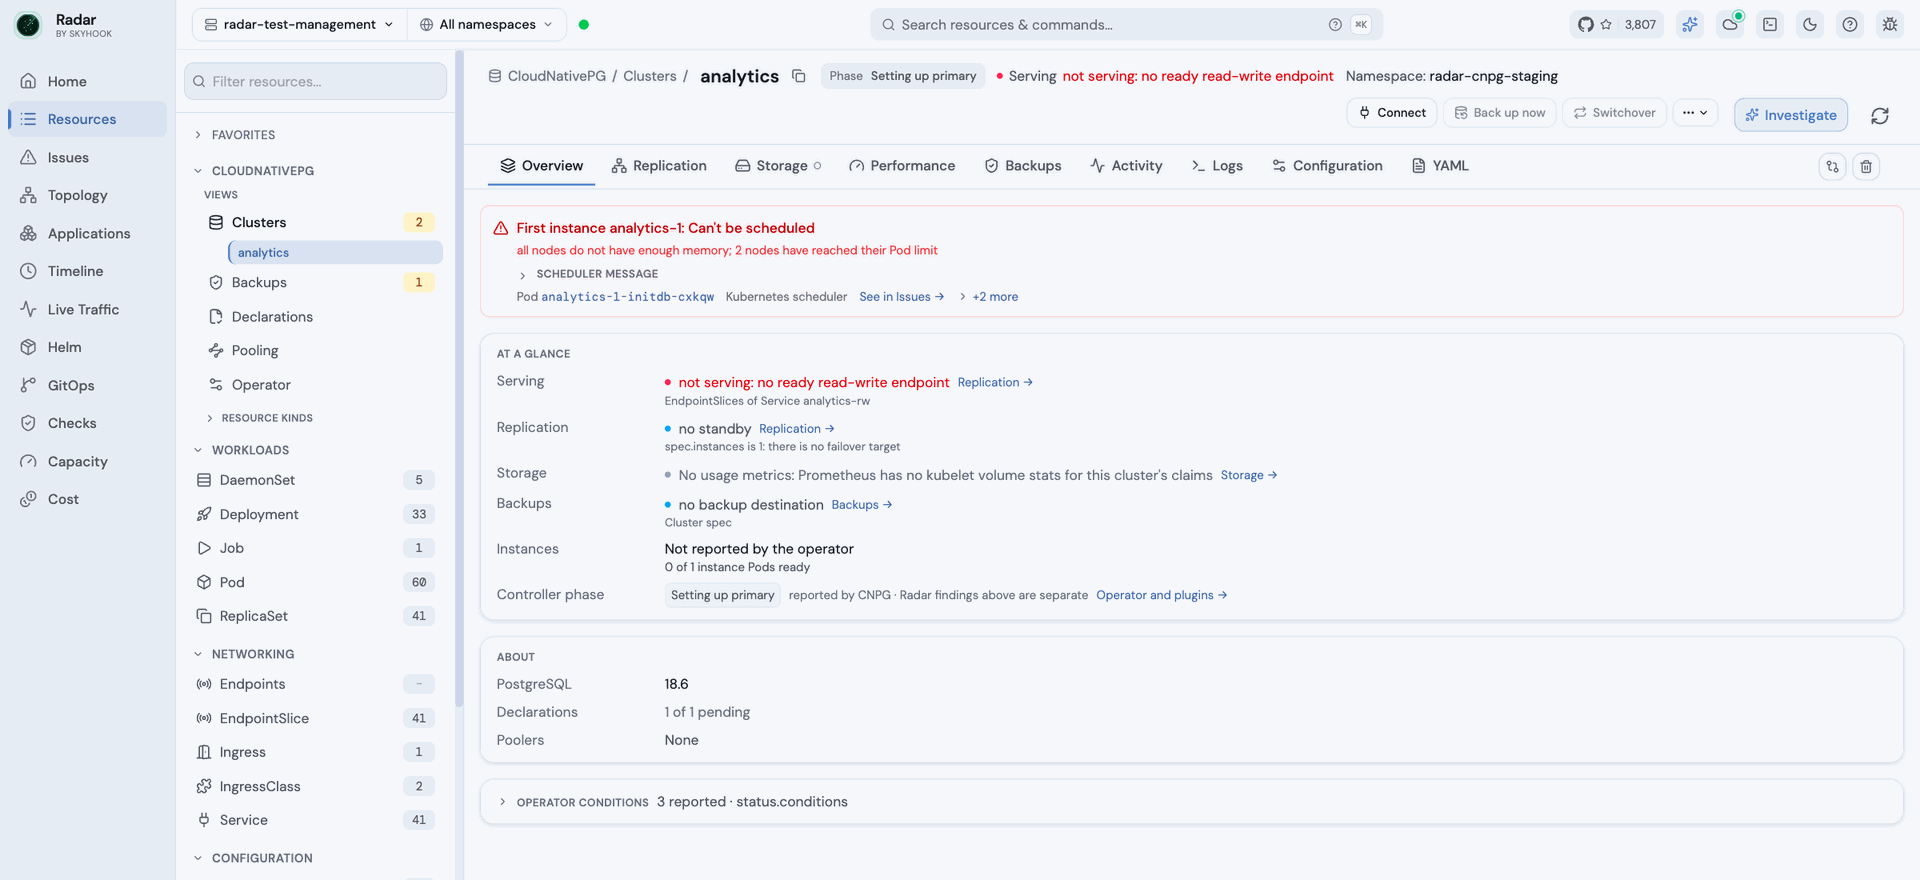
A cluster that cannot start leads with the scheduler's reason, then each health dimension at a glance
replay_lag is an acknowledgement delay that reads zero for a standby that receives nothing, so Radar never presents it as catch-up time.
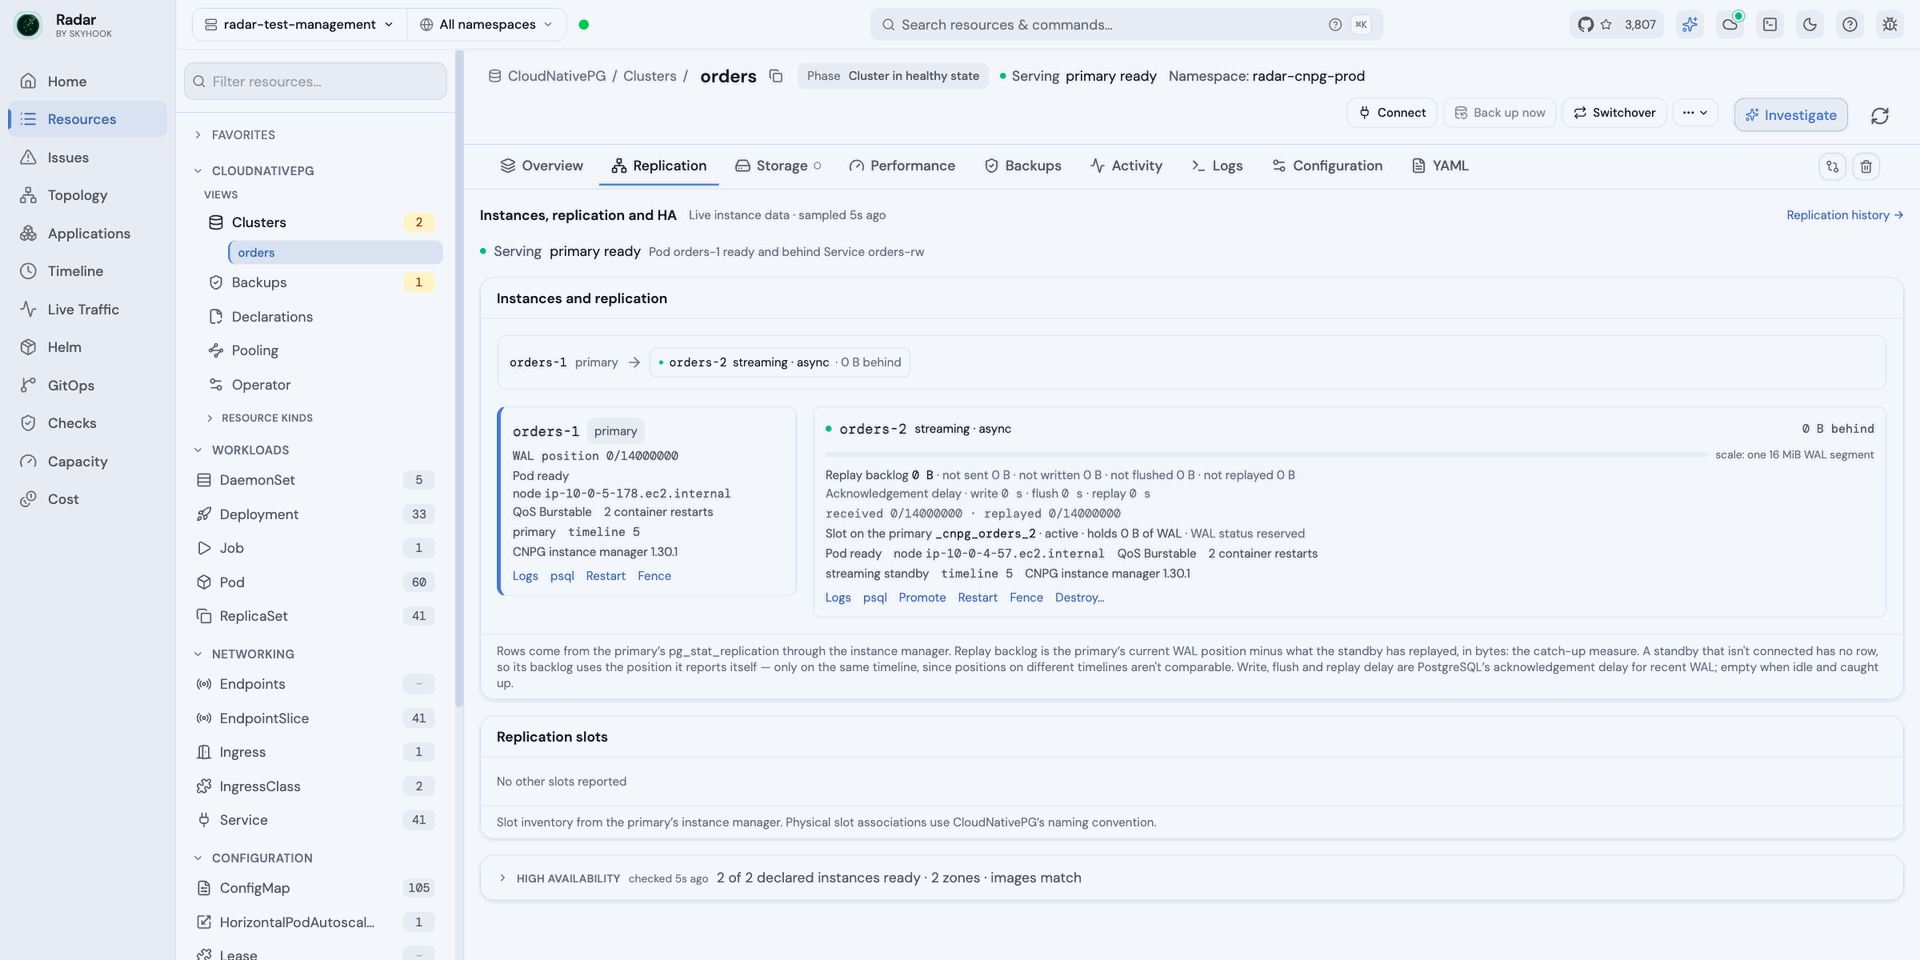
Replication - the primary and its streaming standby, the backlog, and the slot the primary keeps for it
Operations that are reviewed and followed through
Day-2 operations run with your own Kubernetes identity, never Radar’s:- Back up now, switchover, rolling or single-instance restart, reload, fence and lift fence, hibernate and rehydrate, node maintenance, ScheduledBackup suspend, resume, edit and run now, Pooler pause and resume, cancelling or terminating a blocking session, and destroying a standby.
- Every dialog leads with the effect, keeps the literal API write one click away, and asks you to type the cluster name for disruptive actions.
- The request carries the facts you reviewed - the context, the cluster’s identity, the current primary, the fence. The server re-reads them and refuses if anything changed in between, and nothing is retried automatically.
- Writes to objects a GitOps tool manages show whether the next sync is likely to revert them.
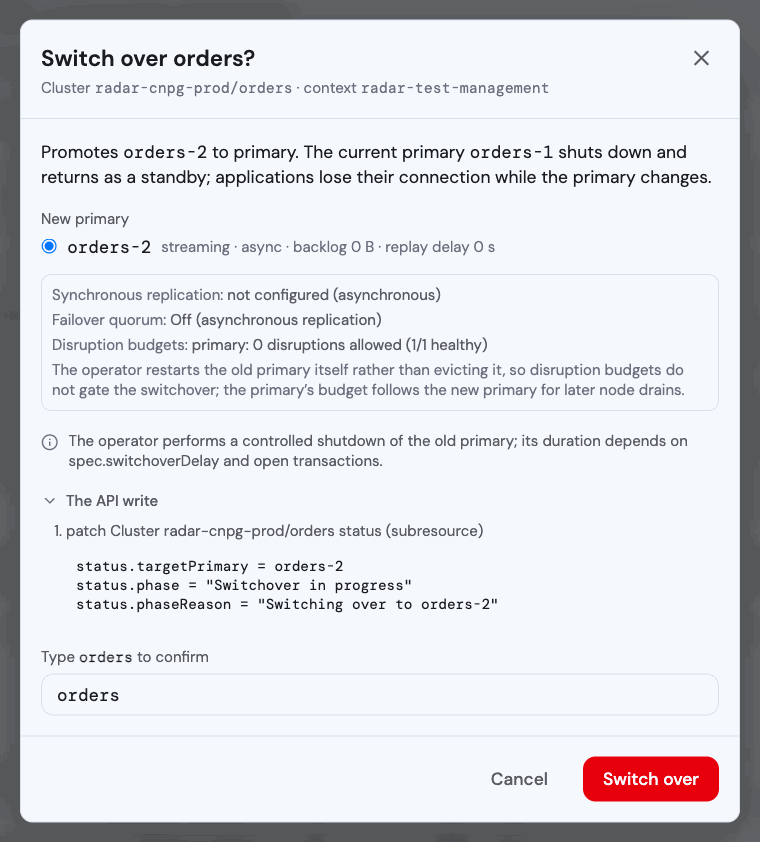
A switchover review - the candidate's replication state, the cluster's sync and quorum settings, and the exact status patch
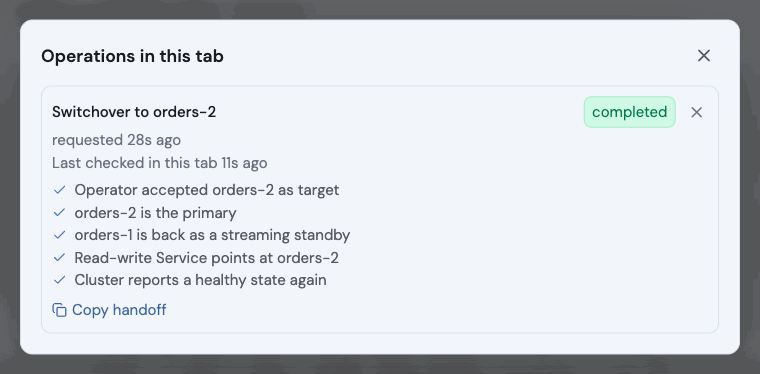
A switchover followed to completion - each step confirmed from what the cluster reports
Backups and recovery
The Backups tab answers the question that matters in an incident: could you restore, and to when? It shows the schedule, the destination, the last successful backup and where that fact came from, WAL archiving, the recovery window, and whether anyone has validated a restore. It catches the setup that looks fine and is not: with no destination configured, CloudNativePG still reports WAL archiving as working, because it accepts each WAL file without keeping it.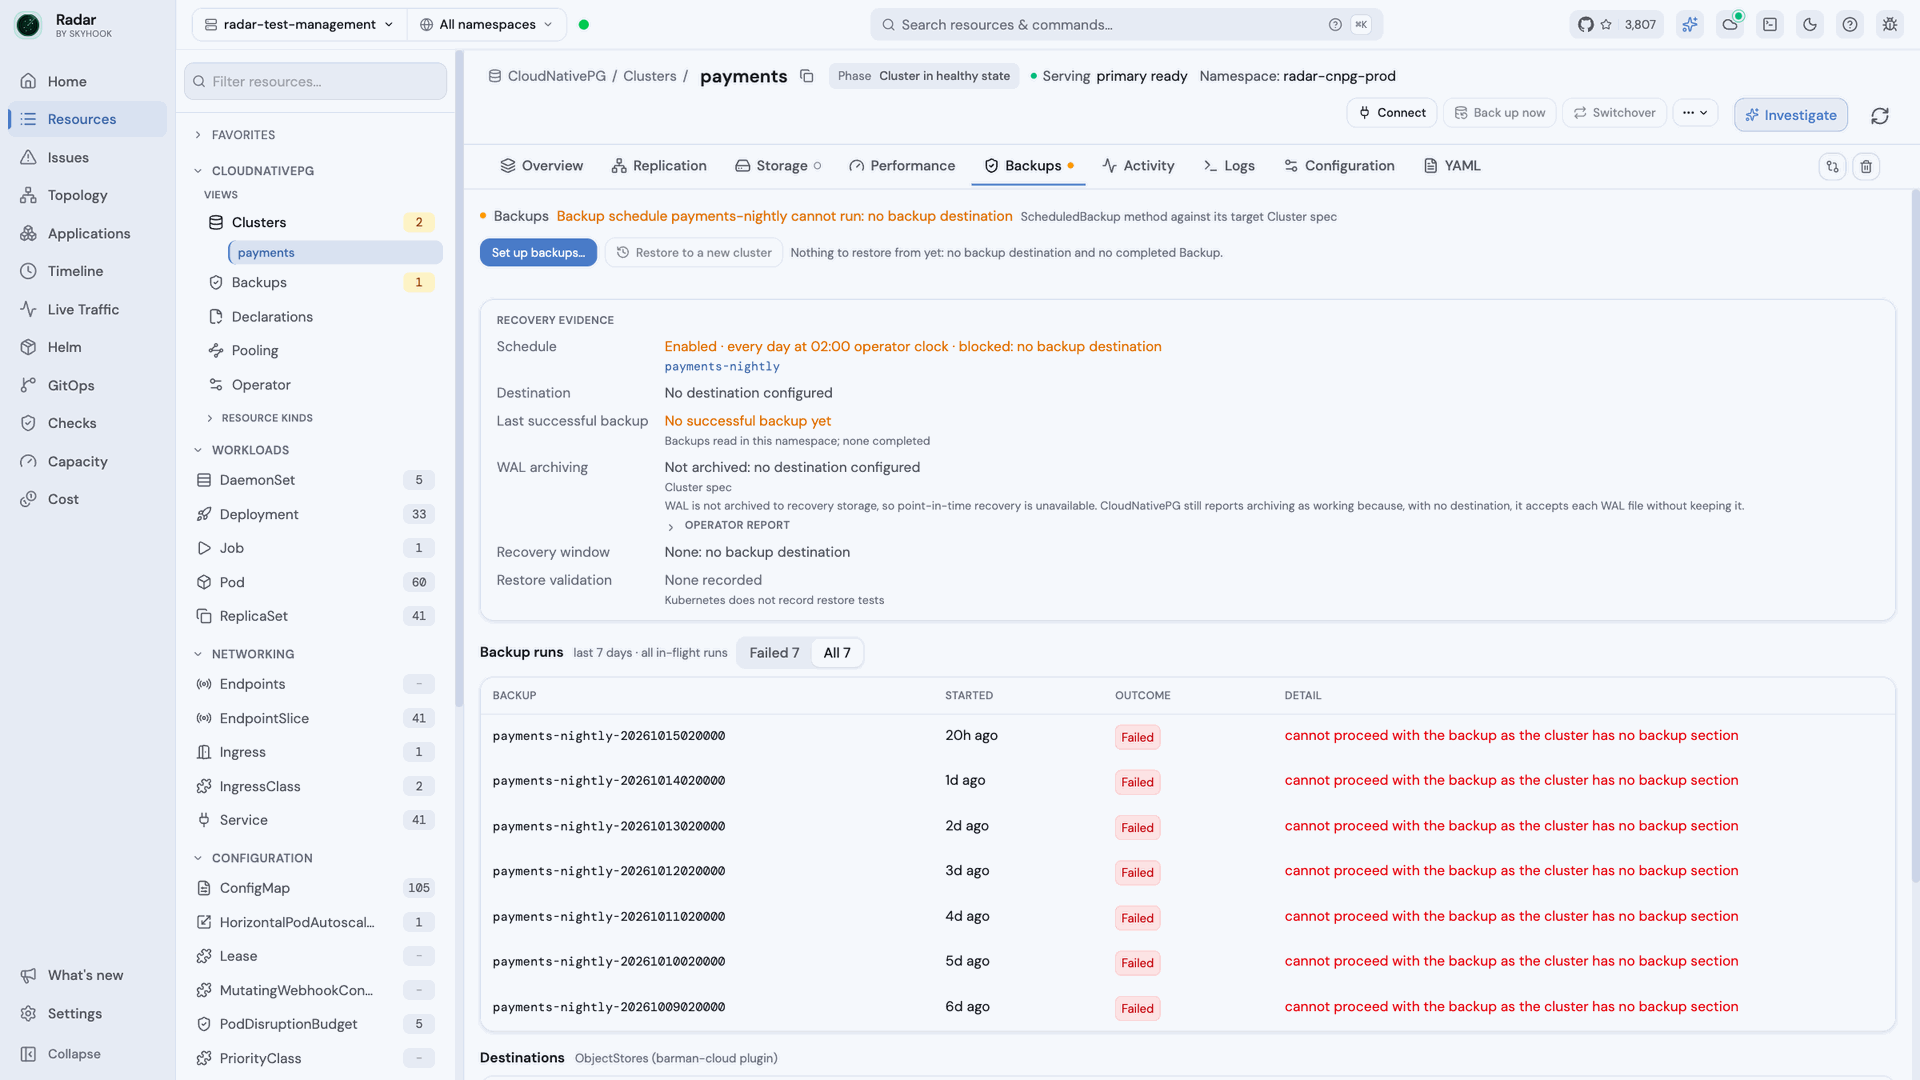
A cluster that looks protected but is not - a blocked schedule, seven failed runs, and WAL that is accepted but never kept
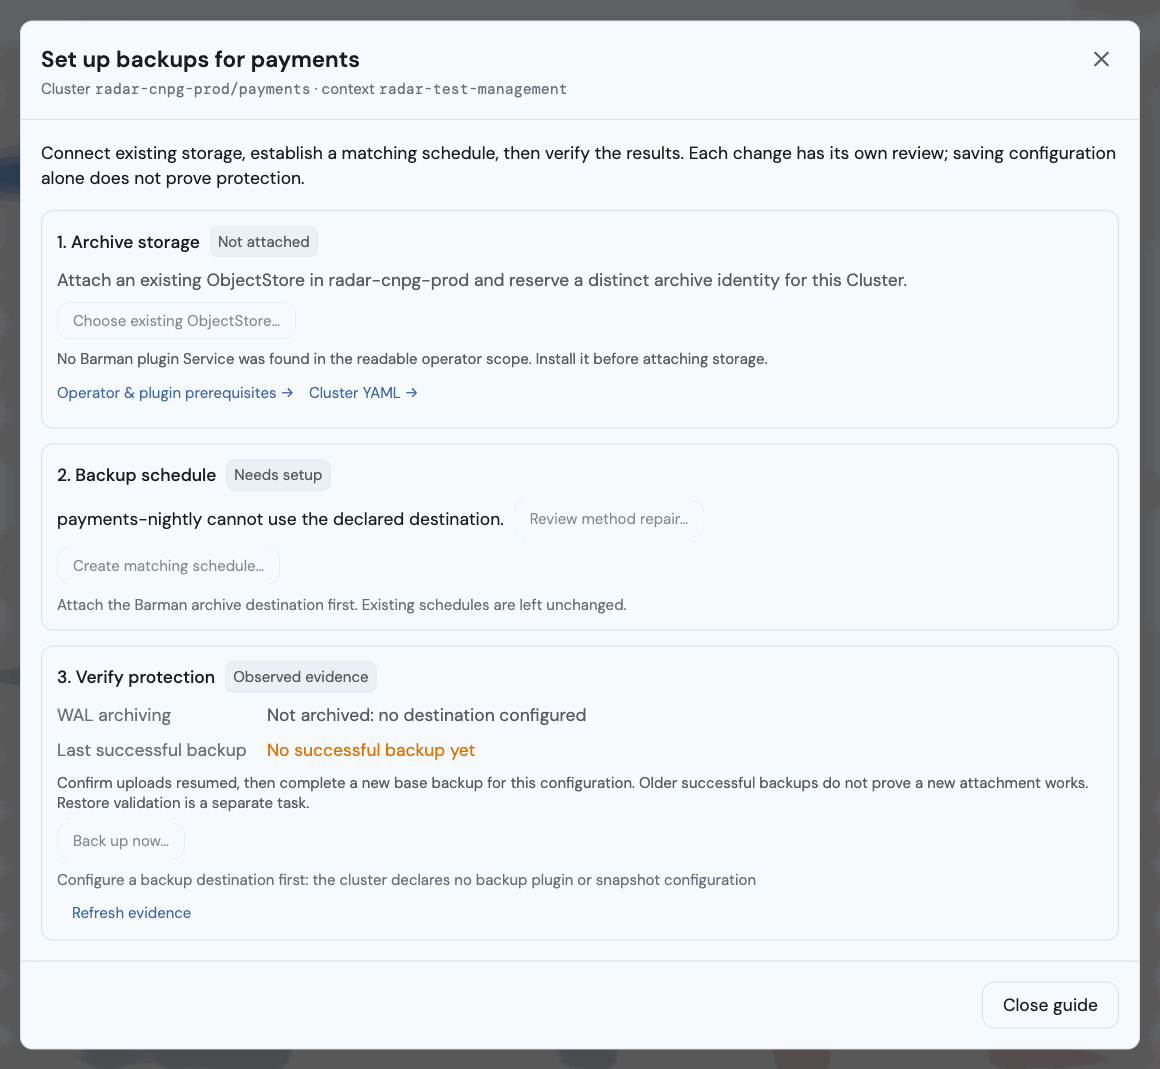
The setup guide - storage, schedule, then verification from observed evidence
Connect and create
Connect lists every address for the cluster - read-write, read-only, any instance, and each Pooler - with whether the cluster’s own Services currently have ready endpoints, plus copy-ready connection strings andpsql commands. Credentials are named, never read: the password stays a placeholder.
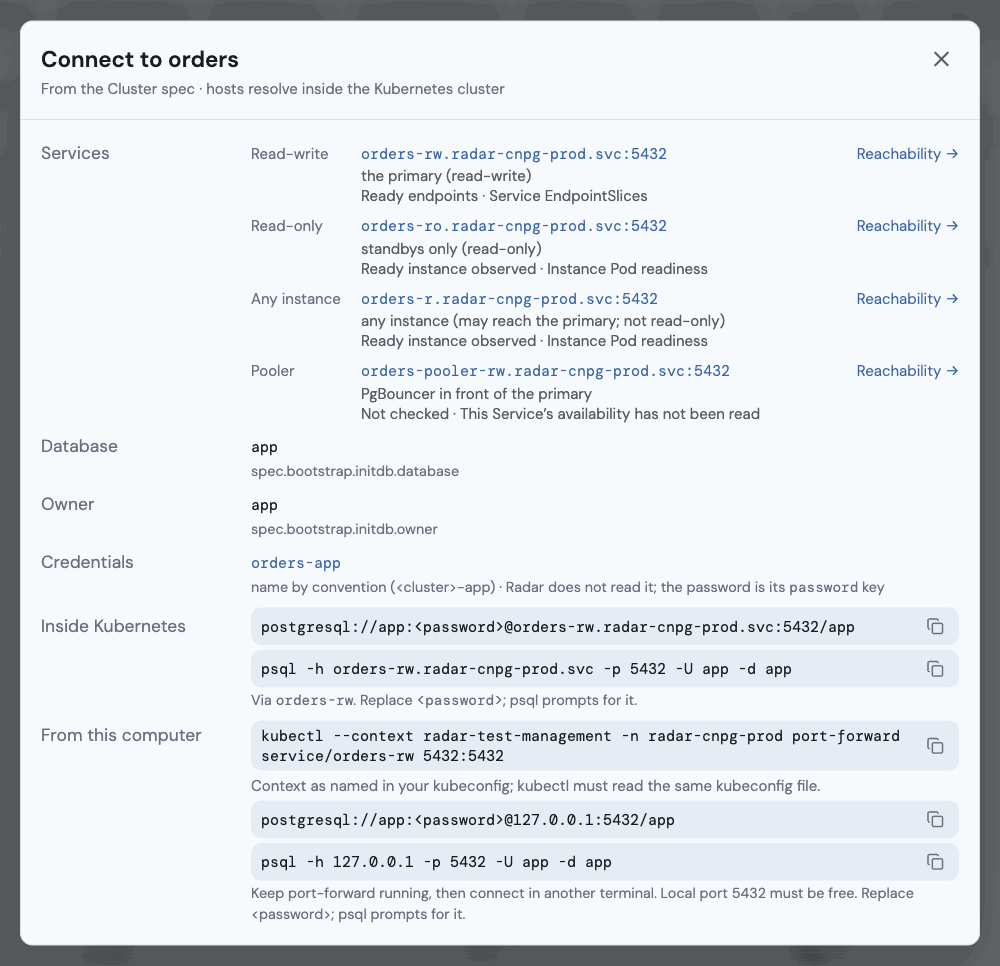
Connect - addresses with their availability, and commands to use them
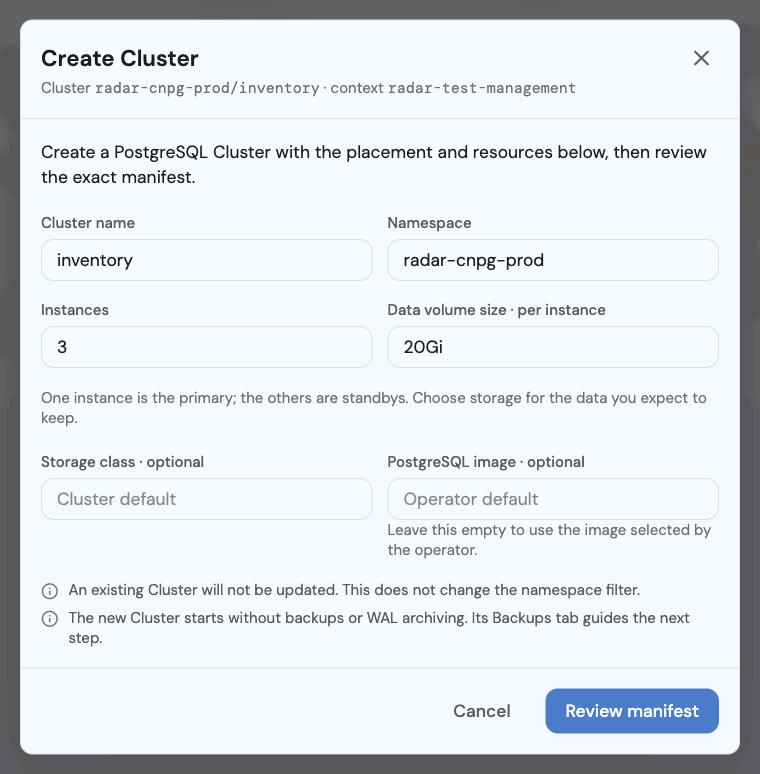
Create a cluster, then review the manifest before anything is written
Operator
The Operator view answers whether CloudNativePG itself is healthy: whether the operator holds its leader lease, which namespaces it watches, whether its admission webhooks have ready endpoints, and reconcile errors per controller. When the operator is not reconciling, every cluster page says so before any status it shows. While its webhook is rejecting writes, actions that go through it are refused up front.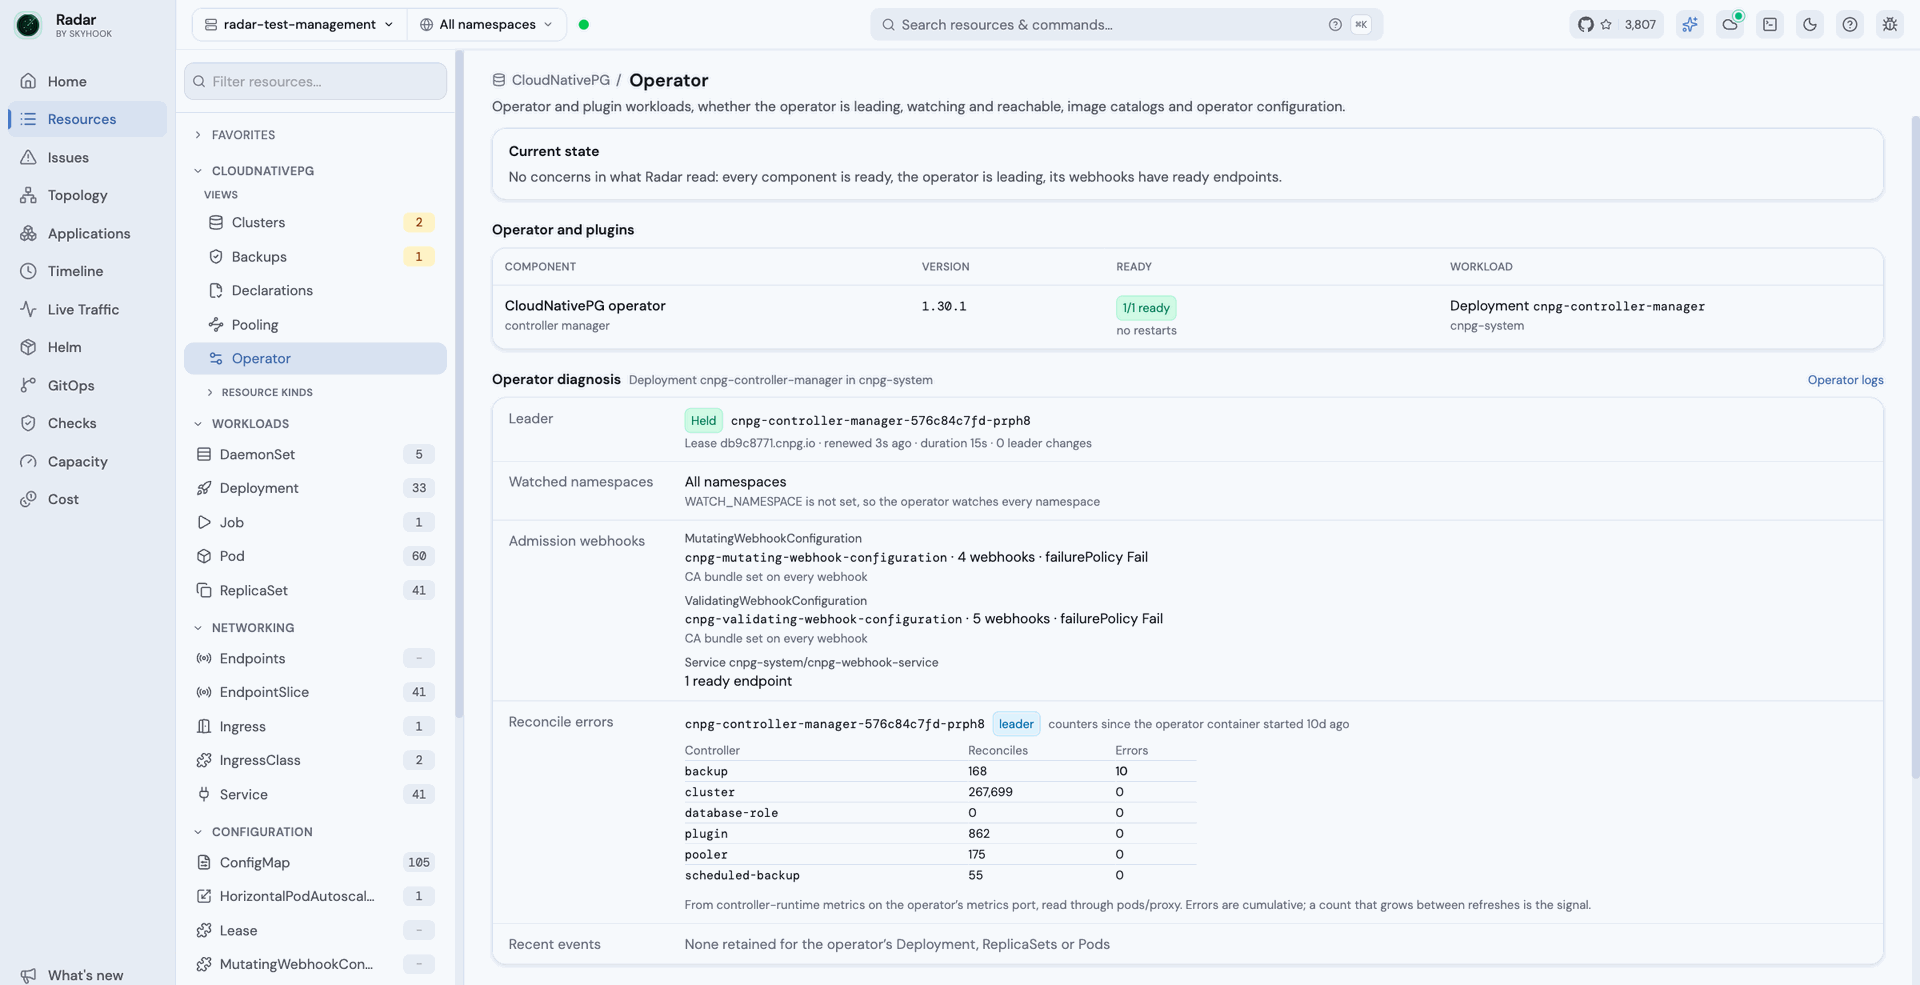
Operator diagnosis - leader lease, watched namespaces, webhooks and reconcile errors
Reading the values
Every value is something the cluster reports, labelled with where it came from. When something cannot be read, the page says so - it never shows zero, “none” or green in its place:- Unknown is never healthy. A standby whose lag cannot be read is “lag unknown”, not caught up.
- Partial is never exact. When some namespaces could not be read, counts read as a lower bound (
≥N). - No access names the permission. A section you cannot read says which grant it needs, instead of looking empty.
Access and data sources
Radar uses your own Kubernetes permissions throughout, and each part of a page is authorized separately: reading a cluster never implies reading its Secrets, Jobs or Pods.- Live instance data - replication, slots, WAL, sessions - comes from each instance manager and PostgreSQL exporter through
pods/proxy. - The blocking view and
psqlusepods/exec; without it, those parts say so and the rest of the page still works. - History charts come from Prometheus when it scrapes the CloudNativePG exporter. Without Prometheus, Radar samples while the page is open.
- Secret values are never read, including in the downloadable report bundle.
Limitations
- Restore validation is a human note. Kubernetes records no restore tests, so a cluster is never shown as tested - only as validated by someone, with who and when.
- Third-party backup plugins. Destinations for plugins other than Barman Cloud are not modeled.
- Single cluster. Like the rest of Radar OSS, these views describe the connected cluster.
See also
- CloudNativePG integration - the per-kind detail views these screens build on.
- Issues - where CloudNativePG problems also surface.
- GitOps - the write guard behind every action.