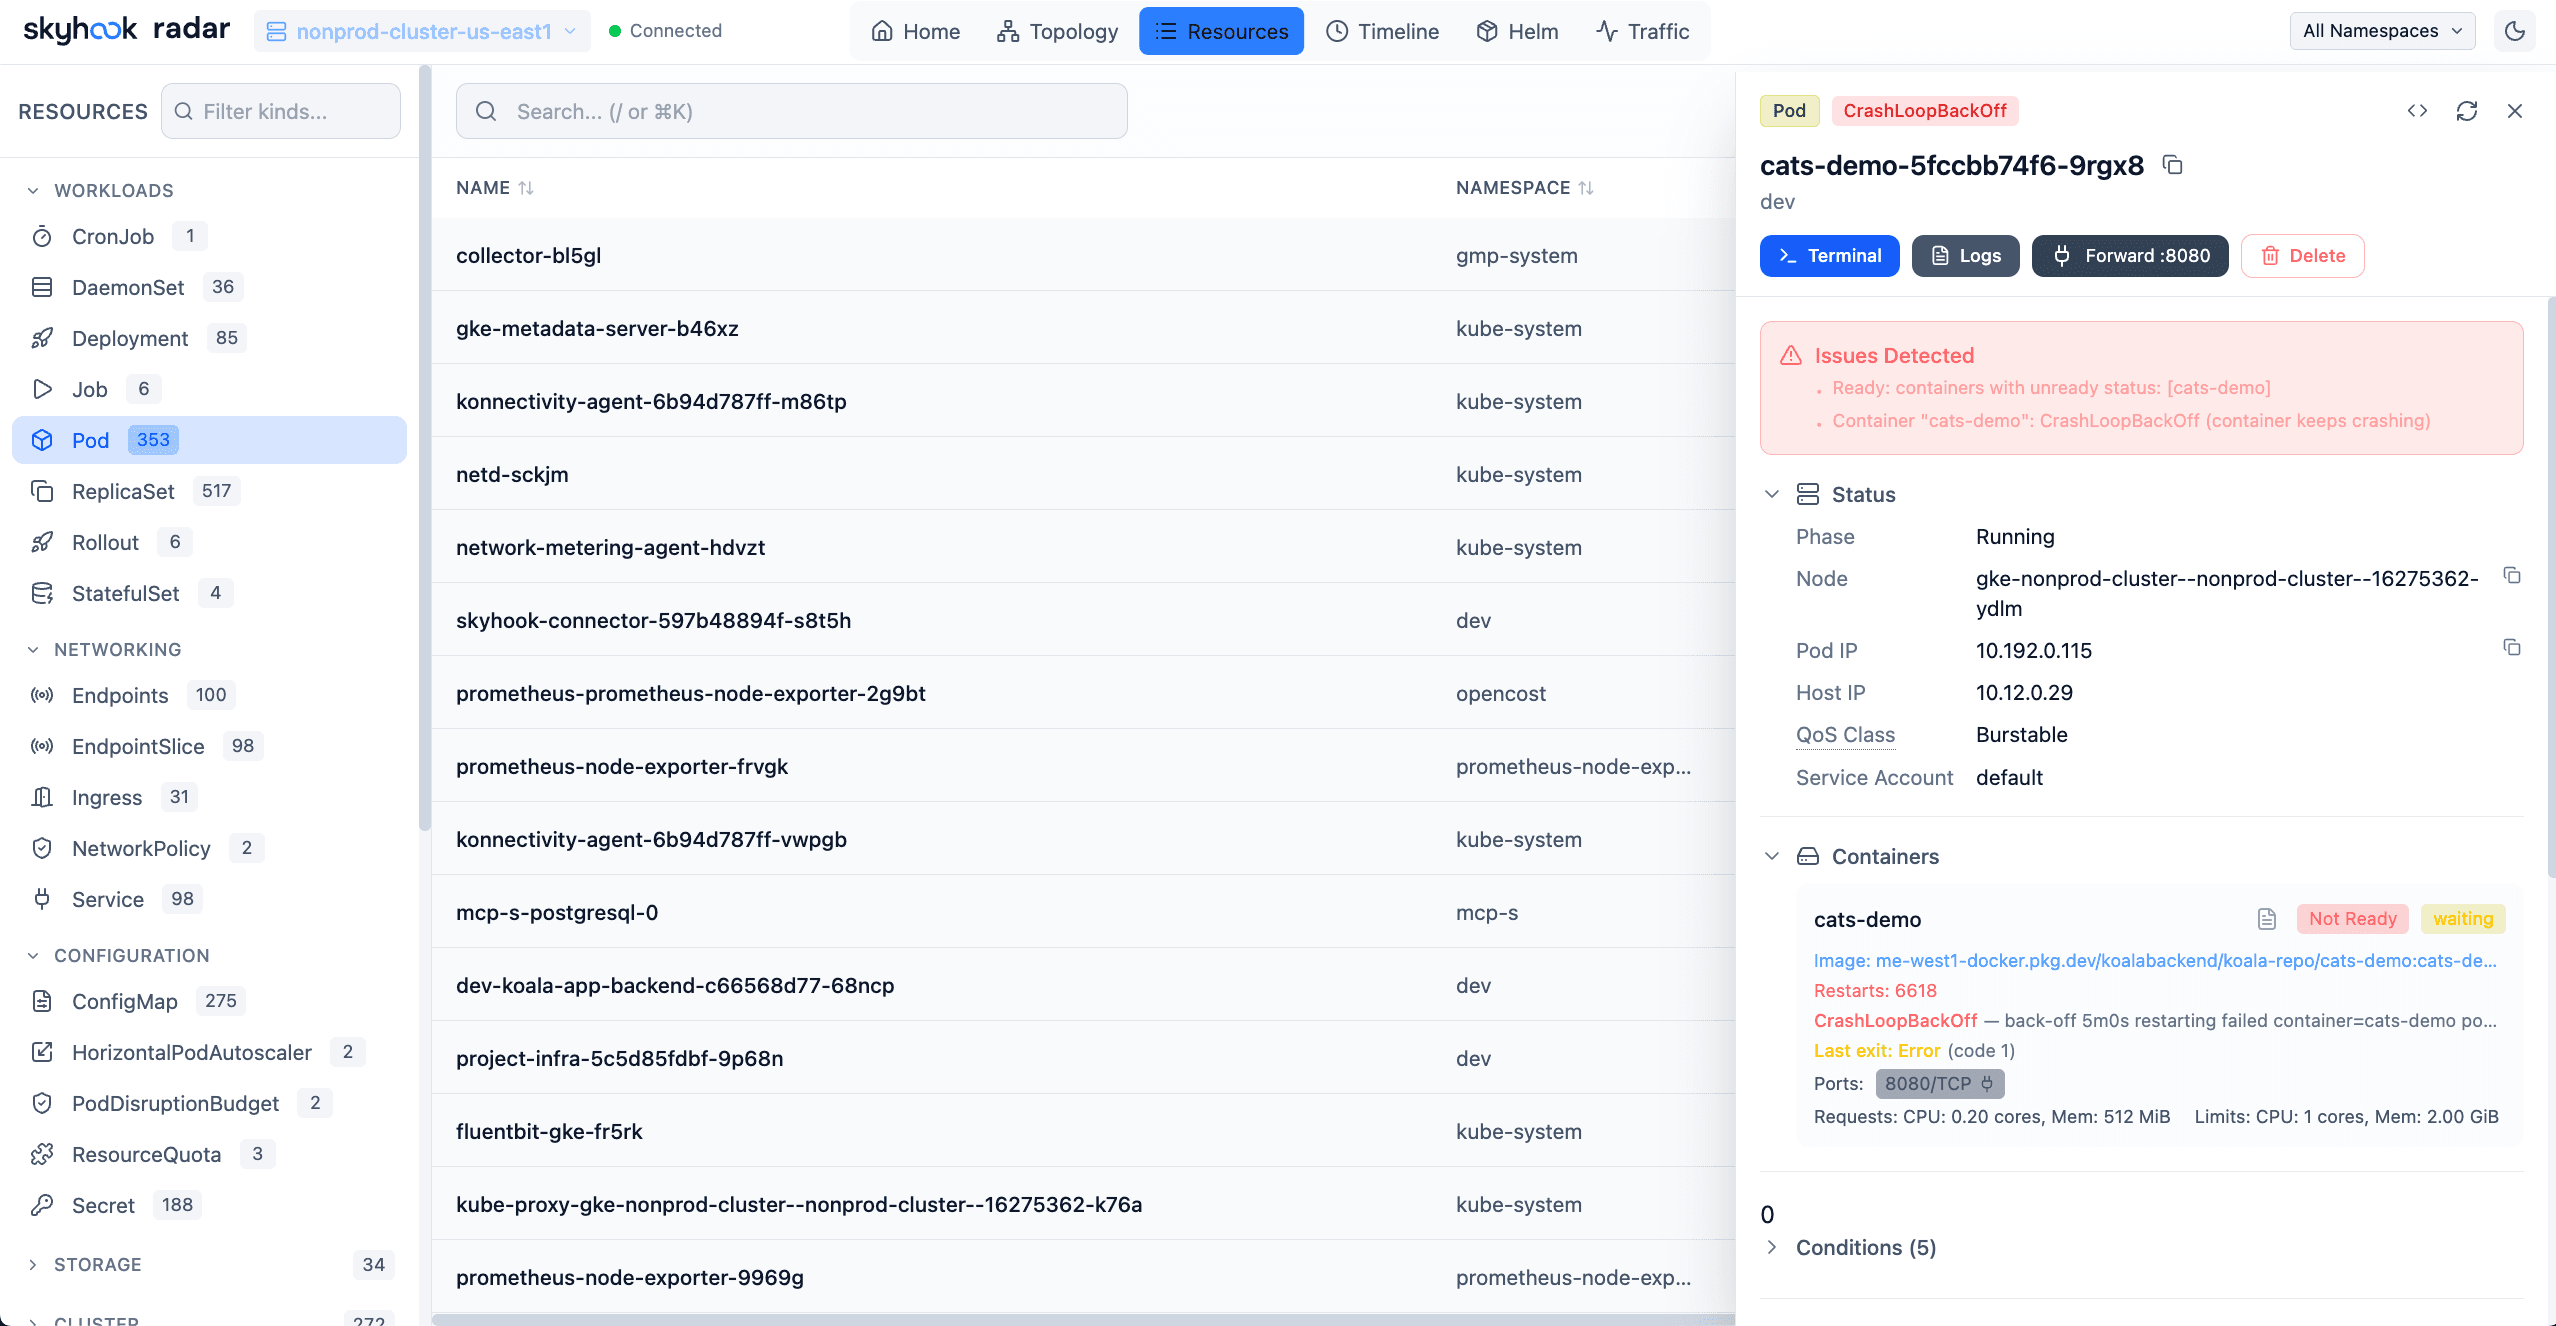
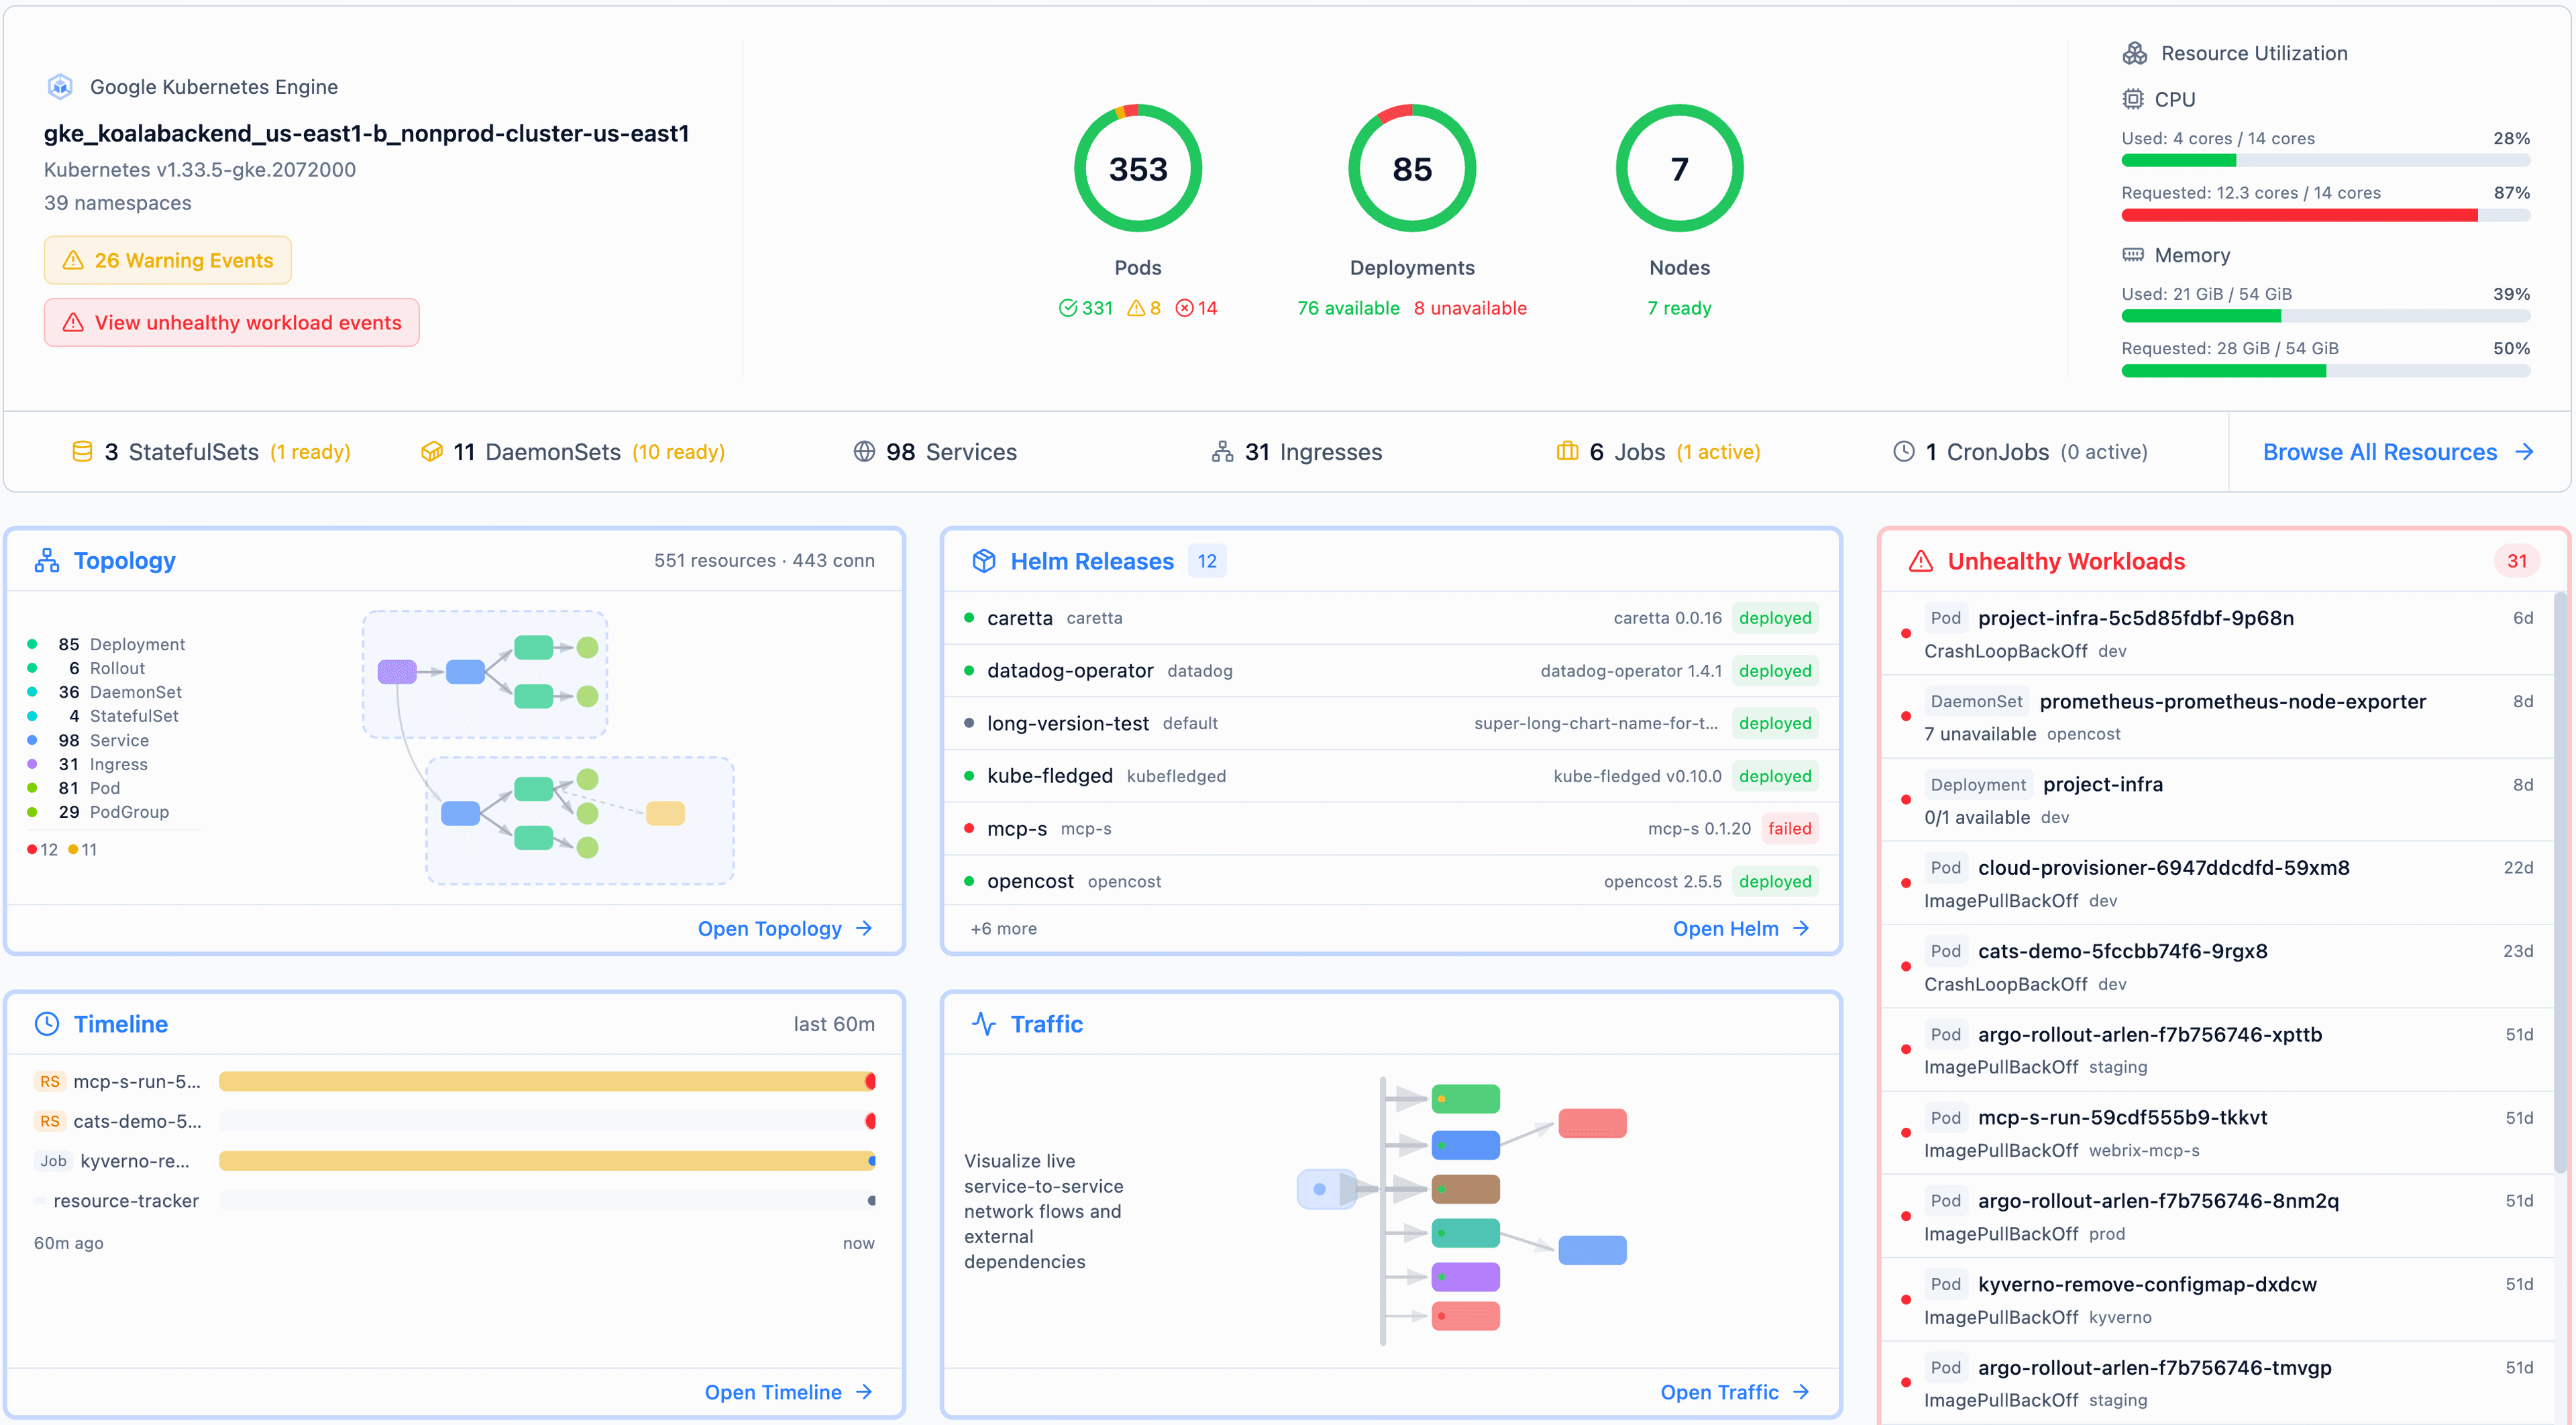
Radar now has a full CloudNativePG workspace. Across all your Postgres clusters it shows health, replication, backups and the recovery window, declared databases and roles, poolers and the operator. On a single Cluster you can create, restore, back up, switch over, fence and hibernate, and you review each action before Radar runs it.
The fleet view opens on clusters that need attention, showing each one's top problem
Backups per cluster: schedule, destination, last successful backup, WAL archiving, earliest recoverable point, and failed backups from the last 7 days
Create a Cluster or restore one from a recorded Backup, with a server dry-run first. Set up backups against an existing ObjectStore
Operations: on-demand backup, switchover, restart/reload, fencing, hibernate, maintenance, and cancel or terminate a backend. You also get psql and port-forward commands, with no credential decoding
On large Cilium clusters, Live Traffic used to freeze or crash the browser tab. It now draws traffic per workload instead of per Pod, fetches much less from Hubble, and lists the connections when a map would be too big to lay out.
Focus on one workload to see only what it talks to, from search, the graph, the table or the workload's page
When the map is too big, connections are listed with dropped flows and 5xx first
One unreachable node no longer breaks the whole view
Issues for stuck deletions and volumes that can't attach
Radar now raises issues for Helm releases stuck uninstalling, custom resources stuck on a finalizer whose operator is gone, and volumes that can't attach to their node's machine type. Namespaces stuck Terminating show what is holding them.
Stuck uninstalls are flagged after 10 minutes, timed from when the uninstall started
Stuck custom resources name the finalizer and its controller. After 30 minutes they go critical if that controller is installed but down or unhealthy
Terminating namespaces show time since deletion, the remaining finalizers, and the namespace controller's own reason
Volume attach failures name the actual incompatibility (e.g. pd-ssd on Hyperdisk-only N4D nodes) instead of the CSI retry message
Cluster Audit now reports PVCs with no consumer, claims Pending for over a day, and Released PersistentVolumes, with size and storage class. Capacity shows why a node pool isn't scaling down, using the Cluster Autoscaler's status.
Capacity flags pools at their minimum size, and shows the autoscaler's scale-down candidates and how long they've been waiting
Nodes that Cluster Autoscaler or Karpenter is removing show as being removed, not as failed
Skip a check for one resource with the radarhq.io/ignore-checks annotation
Helm and GitOps edits: revert warnings, Helm actions fixed for Flux releases
Before Radar edits an object owned by Argo CD, Flux or Helm, it now tells you whether the owner will revert the change. Helm actions on Flux-managed releases now change the release's real objects. Before, they wrote to the namespace that holds the Helm history.
Helm values show Effective Values by default, User Overrides separately, and revision compare covers both
Flux Sync with source now matches flux reconcile --with-source, including HelmChart, chartRef and Bucket sources
Argo CD diffs list the fields Argo says will change, and show Secret rotations coming from Git
Radar no longer keeps every Helm release Secret's payload in memory, which on clusters with many releases was most of what it used. With 100 releases, idle memory drops from 267 MB to 50 MB. At 300, Radar used to be OOM-killed under the chart's default 1Gi limit on its first Helm list.
Issues now reads in full only the releases that are failed or pending, not every release on every request. At 150-200 releases that used to take 8-13 seconds, longer than Radar Cloud's 7-second budget per cluster, so Issues showed those clusters as failed
Applies when Radar can read Secrets: Radar Cloud, installs with auth, or rbac.helm=true
AI investigations find your agent CLI wherever it's installed
Radar runs investigations through Claude Code, Codex, Cursor or OpenCode. It used to look only on the PATH it started with, so Radar Desktop on macOS couldn't see Claude Code in ~/.local/bin and said "No supported agent CLI found". It now also checks the folders those CLIs' installers use.
A CLI installed while Radar is running is picked up without a restart: Check again re-runs detection, and Radar re-checks when the window regains focus
When investigations are off, Settings and radar diagnose say why: no CLI found, --no-mcp, auth, or running in-cluster
These are fixes from an audit of every relationship Radar draws. Services connect only to the Pods they select, every Internet entrypoint connects to the Internet, Gateway API routes attach only to what they reference, and Flux sources show as dependencies of what they feed.
New links: Certificates to their Issuers, KEDA scalers to TriggerAuthentication, custom resources to their CRD, Ingress default backends to their Service
Related resources files each link under the right label, and dependencies read as "depends on", not autoscaling
Radar Cloud MCP: OAuth for every single-org user, compact fleet GitOps results
Any user who belongs to one organization can now connect an MCP client to Radar Cloud over OAuth with the usual one-line connect command. It used to work only for organizations linked to a WorkOS organization.
A user in several organizations gets a clear refusal that points to a personal access token from the right organization's Agents page, instead of being asked to sign in again
fleet_list_gitops returns compact Argo CD and Flux rows (sync and health status, revisions, last reconcile, finalizers) instead of whole custom resources that overflowed the MCP result limit
list_clusters reports which Radar version each cluster runs
Cloud
Radar Cloud: require SSO
Owners can require SSO for everyone except owners, so owners keep access if the IdP fails. Members without an SSO session are sent to the org's SSO sign-in.
It applies to the dashboard, fleet views and MCP
Existing personal access tokens keep working, but creating a new one needs an SSO session
Removing a member revokes their personal access tokens for the org
A crash-looping container used to look like a different problem on almost every check - crash loop, readiness failed, liveness failed, resolved - and each flip meant a new alert and a new investigation. Now it's one issue until the container recovers.
Probe failures, the last exit and how many replicas are looping sit on that issue as evidence; the workload's degraded issue folds into it
Severity follows impact: a fast loop across most replicas is critical, one bad replica out of four is a warning
Covers sidecars and failing init containers; Jobs retrying by design and Pods being deleted don't count
The issue clears on its own about ten minutes after the container stops crashing
Log viewer: the right levels, whole stack traces, and Hide matching
Levels now come from what the logging library wrote - JSON and logfmt fields, Kubernetes controller log headers, common frameworks - before Radar guesses from words in the message, so a level=info line that mentions an error stays INFO.
Filtering to ERR keeps the whole stack trace with its error, and the counts are per error, not per frame
Hide matching drops lines like grep -v, taking a stack trace out together with its error
Lines with no level get their own OTHER chip, so turning off DBG no longer hides nginx access lines
Timeline: a workload's own history, and problems that never hide
A workload's Timeline is now built on the server for that workload alone: its full history, its past runs, and the Services, Ingresses and config in front of it, without neighboring workloads. On the main Timeline, routine activity sits behind a visible toggle and problems always show.
Busy namespaces no longer push a workload's older history out of view
A crash-looping Pod shows under the Problems filter even when it has no owner above it
Separate Metrics, Argo CD and Cost settings for each cluster
Running Radar locally or in Radar Desktop, each kubeconfig context keeps its own Metrics, Argo CD and Cost connections, so one cluster's server or credentials no longer become another's defaults.
Copy settings from another cluster to skip retyping; the copy doesn't link the two
Saved credentials never come back to the browser; type to replace them, or clear them explicitly
Radar Cloud: your Kubernetes RBAC decides what people and AI can do
Hub roles (owner, member, viewer) now cover Radar's own features, and Kubernetes RBAC decides what each person can do in a cluster, including RBAC bound to your IdP groups. An AI investigation reads the cluster as the person who started it, so it never sees more than they can.
Background investigations started by alerts use a view-only radar:ai:reader group, which the Radar 1.16 chart binds
Secret values are redacted from Helm diffs before they reach the model
If you already use OpenCode, Radar can run investigations through it with your existing provider setup, AWS Bedrock included, alongside Claude Code and Codex. Radar finds it on your PATH and offers it in setup.
The full investigation loop works: a diagnosis linked to Radar's evidence, follow-up questions that resume it, and an explicit Apply followed by automatic verification
Healthy and inconclusive assessments can now be explained simply too, not only root causes
GitOps: full manifest diffs, and remote resources opened on the right cluster
Expand a drifted Argo CD resource to compare the manifest Git rendered with the one that's live, side by side or unified, or read either one on its own to search and copy. And a resource that an Application deploys to another cluster now says which cluster it lives on, instead of quietly opening a same-named object on the one you're connected to.
Unchanged regions collapse by default; large manifests stay responsive; a resource missing from Git or from the cluster says so on that tab
Remote Argo CD Applications and Flux objects with a kubeConfig name each resource's destination cluster, and offer Open in <cluster> when a kubeconfig context reaches it
Resource tree nodes show ports, readiness and similar details alongside health (since v1.14.1)
Agents get two new read-only MCP tools: one for cost - namespace summaries, workload and node breakdowns, and trends - and one for CPU and memory rightsizing. In the tools and in the UI, risks (OOM, limit conflicts, throttling) now lead before cost-saving.
If Radar knows the CPU recommendation but not the memory one (or the other way round), you still get the part it knows
An empty result says why: everything's in range, evidence is missing, a filter hid it, or only system workloads matched
A fleet-wide rightsizing scan keeps going when you move between the UI and an MCP request, instead of starting over
Building on Radar's batch and GPU ecosystem support, Kueue, JobSet and Ray resources get their own pages instead of raw spec and status. And a Job or JobSet with no Pods now shows the Kueue admission decision holding it, with links to its Workload, queues and admission checks.
Kueue Workload, LocalQueue and ClusterQueue pages: queue state, admission checks, quota accounting, and the exact conditions the controller reported, blocker first
JobSet pages compare members and drill into each role's Jobs, Pods and logs; MCP resource reads carry JobSet lifecycle and role counts
RayService pages show serving status and revisions; RayCluster pages separate head and worker readiness (running isn't ready) and open the actual Pod
The Topology view now draws a Rollout the way it actually runs: which Pods are canary and which are stable (or active and preview for blue-green), which Service routes to each side, and the canary traffic weight.
The canary weight comes from the traffic router when one is configured, and from the current step's setWeight otherwise
Services now connect to the right side of a Rollout; they used to fail to match because canary and stable selectors key on a hash the Rollout template doesn't carry
The Rollout page shows the step timeline, ReplicaSet progression and the full AnalysisRun history, not only the current run; AnalysisTemplates and Experiments get their own pages (since v1.14.0)
Checks flag expiring TLS certificates, and Issues catches more failures
A certificate in a TLS Secret that expires within 30 days now shows up in the Checks queue with its exact expiry date; under 7 days, or already expired, it's high severity. Issues also detects two more kinds of failure.
Suppress the certificate check per check or per namespace, like any other Check; Secrets Radar isn't allowed to read are left out rather than guessed at
Admission webhook call failures and Strimzi Kafka Connect connector task failures surface as Issues
For OOM, scheduling and image-pull Issues, Radar shows selected differences between the failing Pod and its owner's template, as context to check before changing either
An investigation now reads the way an on-call engineer needs it to: a clear verdict, then the story of what broke, with Radar's own evidence placed where the agent cites it - the metrics chart around the change, the log lines, the Helm revision or RBAC rule behind it - then the next steps.
Evidence cards are rendered by Radar from what it recorded; the agent picks which to show and in what order, but never writes what a card says
Next steps are typed (mitigate, verify, investigate) and state their precondition where one applies
Every result Radar captured stays below the story, whether the agent used it or not
Workload metrics: request and resource dashboards, attributed to the right pods
The Metrics tab on Deployments, StatefulSets and DaemonSets now has curated dashboards from your existing Prometheus-compatible data: CPU, memory and throttling over time, and request rate, 5xx and latency where Beyla or Istio report them. Every series is joined to the pods that actually belonged to the workload at that moment, previous replicas included, so a rollout doesn't erase its own history.
Historical membership follows Kubernetes ownership over time (Pod → ReplicaSet → Deployment), from kube-state-metrics or the standard mixin recording rule - whichever your store retained longer
Radar verifies that the metrics are your cluster's before it trusts them; name-matched charts stay available but are labelled identity-unverified
A 'Metrics sources & coverage' dialog shows which pods each source matched, what was partial or stale, and why - missing, idle, partial, stale and failed observations are never blended
Beyla and Istio request data stay separate and selectable, never summed; workloads without HTTP traffic keep their resource charts and skip the empty request grid
Time range lives in the URL and carries from a resource drawer into the full dashboard
Network policies: why was this flow dropped, and what does each policy do?
A NetworkPolicy detail page now reads the policy the way Kubernetes applies it, and a dropped flow in the Traffic view gets an honest answer: what the network plugin recorded when it dropped the packet, what the current policies say about that connection, and what Radar could not check.
Under a dropped Hubble flow: the deny policy the plugin named, if any, then Radar's own check of the Kubernetes NetworkPolicies as they are now - each policy in plain words: allows this traffic, no matching allow rule, or can't evaluate
Radar never guesses: a pod that is gone, a flow with no direction, a namespace you can't read, or a Cilium policy in play all read as what they are, never as 'allowed' or 'denied'
Cilium clusters handled honestly - Cilium policies are listed, and the Kubernetes-only reading is stated as a reading rather than a verdict
The detail page and list column show what a policy actually does: a peer with both selectors as one condition, missing policyTypes as Kubernetes defaults them, port ranges, matchExpressions
When Radar can't reach a Prometheus it discovered, the Metrics status names the NetworkPolicy that blocks it - when it can see one
Argo CD 3 stops persisting per-resource health in the Application object, which left Radar's resource tree with nothing to show. Radar now asks argocd-server for Argo's own verdicts - with or without a token - and says where each verdict came from.
Each resource's health carries its provenance: Argo's own verdict from argocd-server, or Radar's reading when Argo didn't persist one
Why a Degraded app is Degraded: the failing resources are named on the app, not hidden behind the status
The Argo CD Settings pane and the environment card show the live connection to argocd-server
ApplicationSets appear in the fleet view alongside the Applications they generate (since v1.13.0)
Large clusters: the first screens paint before every kind has loaded
On a big cluster over a slow link, Radar used to sit on a 'Connecting to cluster' splash until the largest kinds finished syncing - minutes, sometimes - and then show an empty Pods list as if it were the truth. The app shell now opens as soon as the first kinds are in, and each view says whether its kind is ready, still loading, or failed to sync.
A sync panel lists every resource kind with its state; ready kinds are browsable while Pods and Deployments are still streaming
A view whose kind hasn't synced shows a loading state and retries, never an empty table with a green badge
Verified on a 14,500-Deployment, 8,000-pod cluster through a throttled link: usable at first progress instead of after a five-minute timeout
Connect a cluster to Radar Cloud from inside Radar
The globe button in the top bar now reaches every install. On a local, unauthenticated Radar it runs the whole connection itself - plan, browser approval, agent install - the same device flow as radar cloud install; every other setup gets a wizard link deep-linked at the real namespace, release, or GitOps owner, because the privilege boundary decides where an install may run.
A plan card shows what will be installed before anything talks to Radar Cloud; GitOps-managed or ambiguous installs are refused with the reason and pointed at the CLI
If an in-app attempt doesn't end connected, the browser fallback carries the outcome in plain words, and the failed card says what happened and whether trying again is safe
The cluster credential never appears in an API response or a log
Drain plan: know what a drain will do before you run it
Draining a node used to be a leap: you found out which pods couldn't move, which PodDisruptionBudgets would block, and which local volumes were about to be lost while the drain was already running. Radar now shows a read-only drain plan first.
Per pod: evicts cleanly, blocked by a PodDisruptionBudget, orphaned (no controller to reschedule it), or pinned by local storage - with the reason
Nothing is evicted by looking; the plan is an estimate you review before the drain button does anything
Reflector: see which Secrets and ConfigMaps are mirrors, and of what
EmberStack Reflector copies Secrets and ConfigMaps across namespaces with nothing but annotations, so a mirror looks like any other Secret until it's stale. Radar now shows the source of every mirror, how current the copy is, and the configuration mistakes the controller silently ignores.
A mirror's detail page links to its source, shows the recorded copy version against the source's current version, and warns before you edit a value a sync will overwrite
Sources list their visible mirrors; topology draws the declared source-to-mirror edge
Local checks flag self-referencing sources, invalid boolean settings, automatic creation without permission, and mirror chains that don't propagate
Agents get the same picture: the MCP resource context carries a reflection block with the declared source, the observed source, and the visible mirrors
Three findings that now say when they couldn't check
An 'unused' ConfigMap, a 'no autoscaler' workload, or a rightsizing recommendation with no OOM history all used to be indistinguishable from a check Radar couldn't run. Each now reports observed, clear, or unknown - and the rightsizing reduction that depends on the autoscaler check is withheld when the check couldn't cover the workload.
Unused ConfigMaps and Secrets: a consumer Radar can't see (a Reflector mirror in another namespace, an unreadable kind) reads as 'couldn't check', not 'delete me'
HPA coverage is decided per workload from what the informer actually watches; a namespace-scoped informer no longer answers 'no autoscaler' for namespaces it never saw
Rightsizing names the workloads whose pods it could not read instead of presenting a recommendation as complete
Import a multi-resource YAML file, by picker or drop
The apply editor already took multi-document YAML you pasted. Now it takes a .yaml file from a picker, or dropped onto the editor, and runs it through the same validation, dry-run review and apply - one path, no surprises.
One .yaml or .yml file up to 6 MiB; what's in the editor is replaced only after a prompt when you'd lose edits
Server bounds are stated: 6 MiB of YAML, 100 documents, and an oversize body is refused as 413 before anything is parsed
Radar Cloud Self-Managed: bind cluster RBAC to your IdP groups
On Radar Cloud Self-Managed with plain OIDC sign-in, a user's IdP groups now reach each cluster as radar:idp:<group>, so you can grant access with Kubernetes RBAC bound to your IdP groups instead of per-user bindings. Sign-in also holds up for users who belong to a lot of groups.
Sessions are kept on the server, so a user in many groups no longer hits a sign-in error, and sessions expire when they should
Groups that can't be forwarded are named in the operator's logs instead of disappearing silently
Investigations: the agent makes its case over Radar's evidence, and history has a home
The agent can now argue: it tags the evidence Radar gathered as cause, symptom, context, benign or ruled out, and lists the hypotheses it rejected under the assessment. It can order and frame the cards; it can never author one, hide one, or soften Radar's own contradiction warning. A new investigations home keeps the history.
A 'healthy' verdict is checked against what Radar captured - a failing probe, a crash, a Warning event, an error in the logs - and the operator is warned about anything the agent left unexplained
Findings gather more of what Radar knows: workload logs, alert rules, Helm releases, permissions, and the workload's vitals captured at the moment of the drop; a workload's HPA is diagnosed on the workload itself
Cited Prometheus range queries render as chart cards with change markers, so 'memory doubled at 14:02' is a chart, not a sentence
/investigations is the durable home: recent runs in a rail, each reopenable by URL; contextual runs stay in the resource drawer; startup progress shows before the agent's first message
Saved assessments can be explained on demand by a capable agent, over the evidence Radar kept
The log viewer gets a proper export: copy or download exactly the lines you're looking at, in the scope and format you chose. And the pod file browser previews text files inline instead of making you exec in.
Copy or download logs with the current container, time range and format applied - what you see is what you get
Inline preview for size-bounded text files in the pod file browser; larger files still download
Pods are attributed to their workloads by ownership, never by name prefix - a pod named like a Deployment no longer counts as one of its replicas
Radar Cloud Self-Managed: run investigations on your own model provider
Radar Cloud Self-Managed can now run its AI investigations on AWS Bedrock or the Anthropic API - so you don't need AWS credentials just to turn investigations on.
Pick one provider per install; Bedrock stays the default
Claude on Google Vertex joined as a third option on September 14
Cloud
Contractors sign in through your IdP, with their own address
External contractors who are guests in your Microsoft Entra or other IdP tenant keep their employer email - which used to mean they could never reach your SSO. Radar Cloud now routes sign-in per organization and admits them on their own address, over OIDC or SAML, after a one-time emailed code.
A per-org sign-in link (by org id or a readable handle) targets your connection directly instead of matching on the typed domain
Guests sign in with their real employer email; an organization that would rather they see no code can still rewrite guests onto a verified subdomain and keep the real address on file
Group-based access from your IdP applies to guests the same way it applies to employees
Investigations: a workspace built on evidence, not a chat transcript
An AI investigation used to be a transcript you scrolled. It is now a workspace: Activity keeps the agent's chronological transcript and raw tool results; Findings presents the assessment, the evidence behind it, and the next steps. Every evidence card is something Radar itself read from the cluster, and you can open the exact source behind any of them.
Findings shows the target's facts, relationships and the focused evidence the assessment cites; bulk searches and inventories stay in Activity. Citing a whole tool response never passes as a specific finding
View source opens the original result and highlights the excerpt; coverage limitations are grouped by source, and a healthy assessment still keeps its qualifications
Explain simply rewrites a saved assessment in plain language on demand, preserving its uncertainty rather than starting a new diagnosis
Apply requires explicit confirmation of the exact instruction; a confirmed write triggers a read-only verification, and an interruption is reported as unknown, never as success
Every retained investigation has a stable link (?ai-run) that survives navigation and reload
Table columns and status badges stop claiming health they never checked
A sweep across every table and topology node in Radar: six columns that could not say anything are gone, two that could are fixed, and status badges no longer report healthy for things nothing verified. Every remaining column across the core surfaces and the CRD integrations now explains itself.
158 columns carry a plain-language explanation of what they show and where the value comes from (40 core columns here, the 118 CRD columns in v1.13.1)
Status cells and topology nodes say unknown when unknown, instead of green by default
Nine new columns that answer a question the table couldn't (v1.13.1)
Kueue Workload admission context in REST and MCP - admitted, pending, or blocked, and by what
Istio policy rows stop asserting a security posture no single object establishes
If your cluster runs Kubecost 3, Radar's Cost view can use its Aggregator API directly - cluster, namespace, application, workload and node cost from the numbers you already pay for, alongside the OpenCost-compatible Prometheus path.
Auto-discovers the local Aggregator Service; central or federated setups point at a URL, with an API key kept out of the config file
SSO-protected Kubecost installs are detected and the right API port picked automatically
Currency labels from OpenCost or Kubecost are respected, with an override when a backend reports the wrong one
In-cluster Radar can keep its event timeline in PostgreSQL instead of memory or a local SQLite file - history that survives pod restarts and can be shared by replicas.
Same timeline, same queries; pick the backend with --timeline-storage
Hardened for production: bounded retention, connection limits, and safe behaviour when the database is briefly away
Hosted investigations you can share, with a budget you can see
Investigations run in Radar Cloud now live in a durable workspace with the same evidence-first Findings as OSS, can be shared with your organization or kept private, and the month's AI budget is visible before anyone hits it.
Private by default; the author can share an investigation with the organization, and the link opens through sign-in
Settings → Organization → Agent access shows two meters - all investigations against the monthly budget, and automatic analysis against its own share - so you can pace the month instead of hitting a wall
Saved assessments can be explained on demand by the hosted agent, over the evidence Radar captured
Integrations (Preview): your cloud account as tools for your agents
Connect an AWS or Google Cloud account from a catalog in Settings, and its APIs become extra tools on the same MCP endpoint your agents already use for the cluster - the credential sealed in Radar Cloud, never handed to the agent.
AWS connects through an IAM role with a two-phase, confused-deputy-safe setup (or access keys with Radar Cloud Self-Managed); Google Cloud through a service-account key
Connected accounts show status, tool count and last use; Recheck all tests them in one click and flags a credential that stopped working
On AWS the agent can do exactly what the role allows; on Google Cloud, Radar requests read-only Monitoring, Logging and Trace scopes whatever the key holds. Radar's read-only MCP mode governs cluster tools, not the cloud account
Update a workload's image, and watch the rollout land
Change a container image on a Deployment, StatefulSet, DaemonSet or Argo Rollout from the workload page and follow the rollout live - old pods draining, new pods becoming ready - with the revision you can roll back to one click away.
Compare-and-swap: the update only applies if the image is still what you saw, so two people editing don't clobber each other
Rollouts that reference another workload are followed to it; promoting after a rollback waits for the controller to catch up instead of silently doing nothing
Requires patch on the workload; the button is hidden when you don't have it
Every CRD gets real columns; the GPU and batch stack gets curated views
CRDs Radar hasn't curated now show the same columns kubectl get shows - the kind's own printer columns, evaluated on the served version - instead of name, age and a guess at ready. And 37 kinds from the GPU, batch, distributed-training and inference ecosystem get proper detail views.
Printer columns from the CRD itself, on any kind, with the same first-match semantics as kubectl
Kueue, Volcano, Ray, Kubeflow training operators, KServe, NVIDIA DRA and more: identity, status and topology for the whole stack
Namespaces you can't access are marked in the namespace picker rather than silently missing
Radar now recognizes 37 GPU scheduling, batch, training, and inference resource kinds, replacing generic CRD tables with useful status, columns, filters, and grouping across the ecosystem.
Follow queueing and admission state across Kueue and Volcano, including workloads, queues, cohorts, resource flavors, and PodGroups
Inspect distributed training and batch workloads from Kubeflow Training, KubeRay, JobSet, LeaderWorkerSet, and KAI Scheduler
See serving and inference resources from KServe, Gateway API Inference Extension, KAITO, NVIDIA NIM, and AMD GPU Operator
Same-named resources stay separated by API group, while every other installed CRD remains browsable with live YAML
Nine evidence-backed checks for the 1.36 to 1.37 boundary, shipped the day 1.37 released: removed feature gates, kubelet flags, API and metric removals, and the transitions that start now.
Blockers for config that 1.37 rejects at startup: 25 removed feature gates, 13 locked to defaults, removed component flags, kubeadm v1beta3, and stored scheduling.k8s.io/v1alpha2 objects
Warnings for silent behavior changes - eventRecordQPS: 0 becoming unlimited - and for PrometheusRules referencing removed metrics
Review findings for surfaces outside the API (the 18 removed kubelet cAdvisor flags) and transitions to schedule (kube-proxy nftables, SELinux mount-time labeling)
Checks gate on the upgrade path, so a cluster already past a boundary isn't nagged about it
Radar now understands canary and blue-green progression end to end: why a rollout is paused or stuck, what its analysis says, and which action moves it forward safely.
Promote, promote fully, skip a step, abort, or retry from the Rollout page, with each action gated on the permission it actually needs
Restart, scale, inspect revision history, and roll back with Rollout-specific semantics instead of treating the object like a Deployment
AnalysisRun pages show metric verdicts, including inconclusive results, and Rollout history records step, weight, pause, abort, and analysis changes
AI agents get the same Rollout context plus explicit management actions through MCP
First-class network visibility for Calico and Beyla
Radar can now show both sides of a network story: the policy Calico intends to enforce and the traffic Grafana Beyla actually observes through Prometheus.
Open Calico IP pools, host endpoints, tiers, and every network policy kind with purpose-built list and detail views
Topology connects Calico policies to the workloads they protect, while staged policies stay visibly separate as non-enforced previews
Beyla and Alloy become Traffic sources for workload-level TCP, UDP, and HTTP conversations without a direct connection to Beyla
When stock Beyla metrics omit ports, protocols, or UDP flows, Radar labels the map incomplete instead of presenting partial evidence as the whole network
An issue alert can now carry its own AI analysis: the alert fires as soon as the issue opens, and once the background analysis lands, a follow-up names the root cause and the one thing to change - by resource, not by patch.
Per rule: turn AI analysis on for the alerts that deserve it; an organization owner consents once for the org
The follow-up arrives at the same destinations and in the same inbox thread; healthy and inconclusive verdicts send nothing
The deep link lands on the analysis, not the issue list
Policy reports are now navigable in both directions: open a workload to see which rules it breaks, or open a policy to see the resources it evaluated and where enforcement is still queued.
Pod and workload pages list failing rules, count passing checks, and distinguish all-passing from no match, unavailable data, or missing permission
Policy pages group affected resources by rule, preserve cluster-wide counts when the visible list is filtered or capped, and surface queued Kyverno work
Modern Kyverno CEL policies, both PolicyException families, and migrating report APIs get first-class fields and effective enforcement status
Unreadable report families and withheld namespaces stay visible as coverage gaps instead of collapsing into a false clean result
CloudNativePG and Velero backup state now feeds the same Problems workflow as the rest of the cluster, including failures that a headline phase or Ready condition cannot reveal.
CloudNativePG surfaces failed WAL archiving, missing or failed backups, overdue schedules, paused Poolers, and unusable volume state
Plugin backup destinations show recovery windows and the clusters they protect, while declarative database objects report whether they were actually applied
Velero failed, partial, validation, unavailable-target, and stalled outcomes become Problems; a later successful scheduled backup supersedes the stale failure
Storage locations show what is stored, restorable, or expired, and backup and restore pages expose the warning and error messages behind their counts
A new tab on Services, Ingresses, Gateways, and routes traces the declared network path and tests it live - DNS, TCP, TLS, HTTP - naming the first hop that breaks. Every result says where it was tested from, and Radar never claims broken when traffic flows, or verified when it couldn't check.
Test from multiple vantages: your machine as a client, the Kubernetes API-server relay, or a consent-gated throwaway pod inside the cluster - the real dataplane, where NetworkPolicy and mesh mTLS actually apply
Non-HTTP Services (Redis, Postgres, Kafka) get honest TCP-connection tests instead of being unsupported - never a fabricated HTTP request at a database port
Skipped checks say why, per vantage, and results state what they don't prove - the real-caller and mesh-identity gaps stay visible instead of reading as green
Agents get the same trace through the MCP diagnose tool's network branch: per-route outcomes with confidence, not just a coarse verdict
A new cluster-wide Capacity area maps the supply your scheduler can use, the systems managing it, and the pending demand that cannot find a home. On Karpenter clusters it shows which declared pool constraints rule a pod out and which provisioning failures are holding capacity back.
One inventory spans Karpenter, GKE, EKS, AKS, kOps, and other labeled node groups without calling a cloud API
Pending pods are grouped by scheduling requirements and evaluated against every NodePool for selectors, taints, limits, and observed shapes
NodePool ledgers separate declared limits, provisioned and in-flight capacity, scheduled requests, remaining room, and sampled usage without turning missing data into zero
Provisioning, disruption, and interruption activity links back from Home, Problems, Pods, workloads, and NodePools
Pick a target Kubernetes minor and Radar checks the live cluster for changes that can block the upgrade or break workloads afterward, through Kubernetes 1.36.
Find removed and deprecated APIs in live objects, Helm release manifests, and last-applied configuration rather than relying on one source
Check control-plane integrations such as admission and conversion webhooks, APIServices, and metrics or field behavior that changes across releases
Inspect node version skew, container runtime and cgroup compatibility, and whether PDB overlap makes a safe drain impossible
Passed, Review, Warning, Blocked, Incomplete, and Not applicable stay distinct, so missing evidence never reads as ready
Owners set up SAML or OIDC SSO from Settings without a support ticket, prove they own their email domains with a DNS record, and let verified-domain colleagues join the organization automatically.
SSO setup opens a WorkOS-hosted portal for your IdP; the connection status and last test show in Settings
Domains are verified with an inline DNS-TXT record; verified domains power both SSO routing and auto-join
IdP groups pass through to Kubernetes RBAC as radar:idp:<group>, so cluster access can follow your directory
Radar OSS keeps a short local event history that ages out inside the cluster and dies with it. Radar Cloud now stores that timeline centrally, so you can look back across restarts, reinstalls, and clusters that no longer exist.
History per cluster by plan - 24 hours on Free, 3 days on Team, 30 days on Enterprise - in the same timeline you already use
History survives a Radar restart, a reinstall, and the cluster going away entirely
Nothing to set up per cluster - clusters on older Radar versions are covered too
Cloud
Radar Cloud Self-Managed, self-serve
Running the Radar Cloud control plane inside your own infrastructure no longer starts with a conversation - start a trial from Settings and get a licensed install command you can paste.
A ready-to-paste Helm command, set up the way you want it exposed: no ingress, Ingress, or Gateway API
A second step re-points clusters already connected to hosted Radar Cloud at your own control plane - moving the connection, not reinstalling Radar
Self-managed deployments get their own OIDC setup, license status, and expiry reminders in-product
A sweep over the agent tool surface: search and events get more precise, permission checks widen, and agents are told when evidence is missing instead of being left to guess.
Search accepts a structured namespace scope, and the log tools follow explicit grep semantics
get_events returns all event types by default, warnings sorted first
Permission checks cover ServiceAccounts, and empty Prometheus queries come back with related-metric suggestions
Agents get an explicit warning when crash logs are unavailable - an empty result no longer reads like health
Radar OSS investigates with your own agent CLI. Radar Cloud now runs the investigation itself, so anyone with a browser can point it at a broken workload and get a root cause back.
Nothing to install and nothing to sign up for - no agent CLI on your machine, no API key, no account with a model provider
Read-only and scoped to the one cluster you're investigating: it can look, and it cannot change anything
Ask follow-up questions, and close the tab without losing the investigation
End-to-end revamp - a durable event store, a log-explorer strip, redesigned swimlanes, list, and drawer, and a per-workload timeline on every resource.
Every resource carries its own timeline, not just the cluster-wide view
Full-history backfill in resumable pages, so deep scrollback survives hiccups
Smarter dedup: serial incarnations of the same event group together, with visible truncation instead of silent caps
Point Radar at a misbehaving resource and it investigates - root cause, the evidence behind it, and a proposed fix you approve before anything changes. Bring your own agent CLI (Claude Code, Codex, or Cursor): no API key, no account.
Investigations run against a read-only tool mount - write tools aren't present, and an approved fix runs in a separate session bound to that one change
Verdicts are honest: root cause with remediation, all-clear, or explicitly inconclusive, with a coarse confidence band instead of a fake percentage
Runs are durable - they survive closing the panel or the tab - and the radar diagnose command starts one from the terminal
Crashloop investigations pull the pod's last-crash logs in as evidence automatically
Application pages lead with a source-aware overview and topology, batch workloads become first-class, and Application History reads as a curated deployment chronology instead of a raw event dump.
Source-aware Application overview and topology
CronJobs and Jobs are first-class across Applications and workload views
Application History curates deployments: what shipped, when, and what changed
Drift detection got a completeness pass backed by the Argo CD API, sync can target a single resource, and a GitOps Resources view puts every managed resource in one filterable table.
GitOps Resources view: filterable, sortable table with a diagnosis-only issue band
Drift detection completeness pass, integrated with the Argo CD API, plus a redesigned GitOps settings surface
Per-resource Argo CD sync - reconcile one resource without syncing the world
A radar cloud connect command starts a browser approval, mints the cluster's credential, and installs or adopts the agent for you - no copying tokens between a dashboard and a shell.
Approve the connection in your browser - there's no token to copy, paste, or keep somewhere safe
Already running Radar in that cluster? It adopts the install you have instead of standing up a second one
Works with hosted Radar Cloud and with your own self-managed control plane
The engine keeps widening what it can name - bad env configuration, stuck deletions, rollout risk, OOM subtleties - with causal links that point from symptom to root cause.
Duplicate env vars, stuck-terminating and finalizer-stuck ConfigMaps and Secrets, and zero-availability rollout risk become first-class issues
Radar Cloud's home page now answers one question in a single screen - is my fleet OK, and what should I look at first - with every card showing what's actually happening instead of a number and a link.
A card per cluster with its open issues, failing checks, and expiring certificates, each one a click away from the matching filtered view
Node and pod counts and CPU/memory pressure per cluster, so you can see which one is under strain without opening it
Update a cluster's Radar in one click from its card, and when a cluster isn't reporting the page says so instead of counting it as healthy
Applications: your software, not a pile of replicasets
Radar now folds related workloads into the applications they actually form, using Helm, Argo, Flux, label and naming evidence - so the first thing you see is your software, not the objects it decomposes into.
App rows resolved from workload, GitOps, Helm and label evidence, each with its own health rollup, class (Service / Worker / Job) and app-vs-add-on classification
Instances of the same app across dev, staging and prod fold into a single row, with a skew badge when one environment falls behind another
Filter by availability, class, type, environment or grouping source; open any app for its own seeded topology and related-object YAML explorer
Open-source Radar gets a ground-up navigation and search overhaul: a left nav rail that holds every view, list surfaces rebuilt on shared primitives, and a global omnibar that searches the whole cluster, not just the current view.
Left nav rail with every view (Applications included) - pin it open or collapse to an icon rail, with g-mnemonic shortcuts
Omnibar advanced search across the whole cluster: kind:/ns:/label:/image:/cluster: filter pills, autocomplete, ranked results, and recents
Issues, Checks, Applications, and GitOps rebuilt on shared list primitives - one filter rail, one badge grammar, consistent column sorting
Themed hover tooltips in place of the browser's default ones, and per-page browser tab titles make multiple Radar tabs distinguishable
The Issues engine now collapses noise into causes: when one failure spawns many rows, Radar folds them into the single root-cause incident, and links causally-related problems across resources so you can see the blast radius.
Same-subject coalescing: a Deployment 'degraded' plus its crashlooping pods become one root-cause row, and a fold never lowers severity
Cross-subject causal links: a memory-pressured node or a broken PVC links to the pods it's taking down, with confidence labels (high / medium / low)
Live Operational Issues now appear in a resource's own detail view, not only in the cluster-wide queue
Exec and port-forward now work against modern clusters and gateways, and when a live forward can't work (in-cluster installs) you can still hit a Service's HTTP endpoint straight from the UI.
Exec, attach, cp, and port-forward moved to the WebSocket API with automatic SPDY fallback - so streaming works behind gateways like GKE Connect Gateway that block SPDY
Probe or Curl a Service's HTTP endpoint from inside the cluster (status, latency, headers, body) when port-forward isn't possible, plus a copy-paste kubectl port-forward command on every port
A Retry button on failed port-forwards re-resolves to a running pod in one click
A set of improvements that make genuine problems easier to spot and cut false signals: high-signal Cluster Audit findings now badge resources directly on the topology and in lists, restricted users get an actionable denied-state for cluster-scoped kinds they can't read, and a few benign lifecycle states that used to read as unhealthy now render neutral.
Per-resource badges flag genuinely broken resources (dangling refs, a Service with no endpoints, deprecated APIs) on the topology graph and resource list - curated to signal, not best-practice noise
Traefik reference-integrity checks catch routers, chains, and errors-services pointing at Services or Middlewares that don't exist, plus new Traefik detail renderers
Cluster-scoped resources your identity can't list now show a copy-paste RBAC request instead of a bare '0 / None found'
Suspended CronJobs, completed Jobs, and other intentional states render neutral rather than amber/red, so they don't crowd the Unhealthy filter
Building on Radar's MCP tooling, AI agents can now run read-only PromQL against your cluster's Prometheus - closing the loop from 'is this workload saturated?' to a concrete metric answer without leaving Radar.
query_prometheus for instant and range queries, all shaped for LLM consumption with oversized-result summarization
discover_metrics and get_prometheus_rules round out the read-only Prometheus toolset
Move between a cluster and the fleet without losing your place
Jumping from a single cluster's views to fleet-scoped pages is now a smooth, same-document hand-off - no full reload, and you land on the matching scoped view.
Same-document hand-off from a cluster's views (including GitOps detail) to the matching fleet-scoped page
Land on the home dashboard, with fleet-shaped cards routed to their scoped fleet tabs
A recent-clusters rail highlights the cluster you currently have open
Cloud
One Cloud shell across the fleet
Radar Cloud's chrome is now consistent from a single cluster to the whole fleet, with a global scope filter and one shared omnibar that searches across every connected cluster.
Consistent navigation and chrome whether you're scoped to one cluster or the whole fleet
A global scope filter to narrow any view to the clusters, environments, and namespaces you care about
One omnibar that searches across the fleet, labeling each result with the cluster it lives in
Cloud
Connect external AI agents over OAuth
Building on org-wide agent management, Radar Cloud now exposes an MCP endpoint that outside AI agents connect to over OAuth 2.1 - so you can grant a tool fleet access without minting and mailing around personal tokens.
MCP OAuth 2.1 with discovery, token validation, and just-in-time membership
A Connected Apps surface to see and revoke which agents have access
An org-wide read-only access mode for look-but-don't-touch agents
Continuing the Issues engine work, Radar's deterministic diagnostic signals get sharper and more actionable - with concrete cause and remediation text for the failures operators actually hit.
Pod issue banners now carry the underlying kubelet/status detail (evictions, image-pull errors, config errors, probe failures) alongside Radar's stable labels
Cause + action for crashloop exit codes, image-pull failures, and admission blockers (quota, webhooks, Pod Security); eventless post-bind startup stalls are caught even after kubelet events age out
HPA diagnosis as a first-class insight: maxed-out, can't-read-metrics, pinned, or paused autoscalers each get an explicit diagnosis
Change-feed correctness: lifecycle events are no longer pushed out by update churn, and a delete+recreate folds into one 'recreated with changes' entry
Turn the fleet Issues queue into alerts: write notification rules and hear about a break the moment it happens, in Slack or the in-app tray, with a durable history of everything that fired.
Notification rules with targeted delivery to the right people
Slack and in-app tray destinations
Durable alert history that deep-links back to the issue
Radar now surfaces GPU and other extended-resource capacity and requests from nodes through pods and workloads, with first-class NVIDIA GPU Operator and Kubernetes Dynamic Resource Allocation support.
Extended-resource (GPU) capacity and requests surfaced on nodes, pods, and workloads
The Issues engine moves past pod-startup failures into the things that actually wake you up - GitOps sync failures, autoscaler problems, and stalled rollouts - each with a probable cause and the change that triggered it.
GitOps/ArgoCD sync failures diagnosed with cause and remediation
HPA and autoscaler problems surfaced as first-class issues
Detects pods that bind to a node and then silently stall with no events
Every issue carries its timing and the meaningful change that preceded it
Fleet Issues & Checks - one triage queue for the whole org
The Issues and Checks queues go org-wide in Radar Cloud: every cluster's failures and policy findings roll up into shared queues your whole team triages from, instead of each person re-discovering the same problem.
Org-shared triage - acknowledge, snooze, or dismiss an issue once for everyone
A Checks remediation queue with org-level Policy to mute a category or check
Grouped by subject, the same triage model as single-cluster Issues
A reworked Issues view built to answer one question: what's actually broken in this cluster right now. A classification engine groups failures by subject into a triage queue you can work straight through.
Pod-startup diagnostics plus coverage for runtime and platform failures
Kyverno policy violations and Checks findings feed the same list
Surfaced on the home dashboard so problems are the first thing you see
A global scope picker narrows every fleet view to the clusters you select, so a large org can focus on the handful that matter right now instead of scrolling past the rest.
One scope picker that filters the whole fleet, not each page separately
The command palette now indexes fleet resources inline, so ⌘K reaches across clusters
Prometheus rightsizing overlays and workload charts
The metrics view goes from raw graphs to actionable guidance - overlaying requests and limits against real usage and surfacing the charts you actually debug from.
Request/limit overlay with rightsizing suggestions
HPA, PVC, and restart charts
CPU/memory requests and capacity shown even when metrics-server is unavailable
Custom HTTP headers for auth-protected Prometheus backends
Pick two clusters and diff the same resource side by side as YAML - the fastest way to catch the staging-vs-prod drift behind 'but it works on the other cluster' bugs.
Side-by-side YAML diff for any resource across two clusters
Wired into fleet search, so you can jump from a match straight into compare mode
Cloud
Radar Cloud Self-Managed
Run the entire Radar Cloud control plane and dashboard inside your own infrastructure - the same fleet experience, with no dependency on our hosted service.
Self-managed control plane and web app for air-gapped or compliance-bound teams
Runtime-configurable deployment shape with provided container images
Cloud
Org-wide agent management
Radar Cloud has spoken MCP since the early builds; this adds the governance layer on top - a dedicated Agents page that inventories every agent and token across the org, so you can see and control what AI has access to.
A dedicated Agents page, promoting MCP setup out of the Home screen
Org-wide inventory of personal access tokens with activity status
A persistent Write badge flags agents and tools that can mutate cluster state
Cloud
Cross-cluster GitOps in Radar Cloud
See every ArgoCD and Flux application across your fleet in one list, then drill into any of them with full visualization parity with single-cluster Radar.
Applications from every connected cluster in a single GitOps view
Destination correlation maps each app to the clusters it deploys to
The same actions and sync visualization you get inside one cluster
Two rounds of work aimed at the cluster sizes where Radar previously felt sluggish: a leaner cache (less memory, less bandwidth on every refresh) and a smarter first paint (no more flickering through three intermediate states before settling).
Cache trim: drop managedFields and CRD schemas from the dynamic cache, where they bloat memory without ever being read (v1.5.4, Apr 24)
First paint: ship a minimal-set frame and use a patience window to coalesce the initial loading flicker, so topology and resource lists settle into final state directly (v1.5.8, May 2)
A hosted overview that rolls up health from every connected cluster onto one screen, so the first thing you see is what needs attention - no opening each cluster to find out.
Problems, certificate inventory, checks, and package versions aggregated across all clusters
Fleet-wide search to locate any resource in any cluster
Logs viewer: timestamp formats, stack traces, field filter chips
Logs viewer gets a power-user pass. Choose absolute / relative / epoch timestamp formats, toggle ANSI and stack-trace folding, and filter on any structured field with one-click chips.
Radar OSS gains the plumbing it needs to run as part of Radar Cloud: a self-upgrade endpoint, version/namespace advertisement to the cloud handshake, embedded-mode chrome hides, and a settings strip + default RBAC bindings for cloud-managed installs.
Self-upgrade endpoint - in-cluster Radar can upgrade itself (Helm RBAC ported in v1.5.4)
Cloud-mode auth/RBAC, settings strip, and default RBAC bindings
Embedded-mode chrome hides for when Radar runs inside the hosted dashboard
Support for OIDC Back-Channel Logout - your IdP can now terminate Radar sessions server-to-server when a user signs out elsewhere. Plus cookie size safety fixes and an OIDC prefix option for installations sharing a domain with other apps.
Command-palette ranking gets retuned for the most-used kinds and actions, and ⌘K now works while focused inside text inputs (with soft suppression so you don't yank focus mid-typing).
Radar now understands Cluster API. Browse CAPI-managed clusters across AWS, GCP, and Azure, jump into any of them with a one-click kubeconfig download, and switch the topology view into Fleet mode to see every workload cluster on a single canvas.
AWS, GCP, and Azure CAPI provider renderers with provider-aware UI
Fleet topology mode for multi-cluster environments
Condition-based CAPI problem detection surfaced on the dashboard
Kubeconfig auto-connect and 'topology-controlled' badges on managed clusters
Generic 'render YAML for any kind' is fine until you actually need to debug a CNPG cluster or an Argo Workflow. This release ships dedicated renderers with the right fields, statuses, and problem detection per provider.
A built-in audit that scans your cluster against security and efficiency best practices and groups findings so you can fix them in batches instead of one resource at a time.
Grouped findings UI - see every Pod missing a resource limit in one row, not 200
Honors Kubernetes inheritance: a check on a Deployment doesn't double-fire on its Pods
Click through from any finding to the resource and the exact field to fix
Comprehensive rendering for Kubernetes NetworkPolicies (and Cilium policies) with a visual flow diagram so you can finally see what each policy actually permits, not just read the YAML.
Visual policy flow: ingress, egress, and the selectors that route them
Traffic correlation - cross-reference policies against live Hubble flows
You could already edit existing resources. Now you can create new ones (or paste a multi-document manifest) directly from the UI - with the same RBAC capability checks Radar runs on every other write.
OIDC integration improvements aimed at tighter enterprise environments - the kind that have a self-signed CA in front of the IdP and credentials you can't paste into a config file.
TLS skip-verify and custom CA cert flags for OIDC providers
Load OIDC client secret from an existing Kubernetes Secret
'Authenticate in terminal' button when the embedded browser flow can't complete
Service traffic view goes from L4 connection lines to full L7 request inspection. Latency, DNS lookups, HTTP status codes, request paths, and per-flow filters - reading from Cilium Hubble where it's available.
Per-request latency, DNS resolution times, HTTP status codes, and request paths
Flow list view with protocol filters
Dock integration for keeping the traffic graph open while navigating
Topology view now collapses cleanly through three levels - cluster, namespace, workload - with smart default collapse states so big namespaces don't blow up the canvas.
Radar now respects Kubernetes RBAC end-to-end. Sign in with your IdP, and every read, write, and exec runs as you - no more 'Radar can do anything its kubeconfig can do' shortcut.
OIDC sign-in with your existing identity provider
Per-user RBAC capability checks on every action
OIDC RP-Initiated Logout (v1.3.3) for IdP-initiated session end
Visual refresh: every color, spacing value, and elevation now flows from one design token set, which means consistent dark mode, fewer one-off components, and a cleaner base for everything we ship next.
Before you delete a Deployment, see every dependent resource that's coming with it. The delete dialog shows the full ownership chain so you don't accidentally take out a ServiceAccount you didn't mean to.
Structured log viewer + SSE-driven live resource lists
Logs viewer learns to parse JSON and logfmt natively, with field-level highlighting and an expand-all action. Resource list views switch to server-sent-events for instant invalidation - changes from another tab or kubectl reflect without manual refresh.
A local shell pinned to the active cluster context. kubectl, helm, whatever you have on your PATH - no tab-switching to your terminal, no copying cluster names.
First-class node operations from the cluster view. Cordon a problematic node, drain it for maintenance, uncordon when you're done - with the same RBAC checks as everything else.
View preferences, namespace filters, and cluster connections now persist across sessions. There's also a real Settings panel inside the app - no more hand-editing JSON.
Streaming progress for Helm upgrades and rollbacks
Helm upgrade and rollback operations now stream progress in real time instead of going dark for the duration. Watch hooks fire, resources reconcile, and status flip live - not as a wall of text after the fact.
Export any topology view as a high-resolution PNG or WebP - viewport capture or full canvas - to share in a Slack thread, paste into a doc, or attach to an incident review.
Quality-of-life pass on transitions, easing, and a stack of small papercuts that piled up during the v1.0 push. Drawer open/close, topology pan/zoom, and table-row state changes all feel meaningfully nicer.
A week after 1.0, three meaningful additions: cluster cost visibility via OpenCost, Istio service-mesh topology rendering, and an MCP server expansion that gives AI agents Helm, workload, and GitOps tools alongside the existing read-only resource browsing.
OpenCost cost view - per-namespace and per-workload spend, no extra dashboard
Istio service-mesh topology with mTLS and routing context
Post-1.0 dashboard expansion: HPA / CronJob detection, node health
Day-after-1.0 follow-up: dashboard now detects and surfaces HPA and CronJob state, adds node-health rollups, and converges the MCP and REST dashboard views so AI agents and the UI see the same shape of data.
After ~30 days of weekly OSS drops, Radar hits 1.0. The major surface area - topology, event timeline, traffic, resource browsing, Helm management - is stable and the v1.0 release adds a stack of features that earned the version bump.
Prometheus metrics integration with auto-discovery
PV, StorageClass, PDB, and VPA renderers
Comprehensive keyboard navigation across the app
Inline secret data editing with RBAC capability checks
Init Containers section in pod details, sortable/filterable CVE view
MCP server config so AI agents can introspect Radar's view of the cluster
Deeper rendering for the CRDs you actually use to run modern Kubernetes. Karpenter NodePools, KEDA ScaledObjects, and Gateway API resources get type-aware detail views instead of raw YAML dumps.
Radar exposes an MCP (Model Context Protocol) server so AI agents - Claude Code, Cursor, Continue, anything that speaks MCP - can query your cluster through Radar's typed view instead of shelling out to kubectl.
MCP server gives agents structured access to topology, events, logs, and resources
Pinnable favorites for resource kinds in the sidebar
Resizable columns, column picker, and persisted resource-table preferences
Container selection submenu on the Logs button for multi-container pods
Trivy Operator support and TLS certificate inspection
Two security-focused additions: first-class Trivy Operator rendering for VulnerabilityReports and ConfigAuditReports, plus inline parsing of TLS certificates stored in Kubernetes Secrets so you can see expiry, issuer, and SANs without copying them out.
Trivy Operator: dedicated renderers for vulnerability and config audit reports
TLS certificate info for K8s secrets - expiry, issuer, SANs surfaced inline
Generic column filter system for resource deep-links
Three big infrastructure pieces in one drop. Radar gets a native desktop app via Wails v2 (smaller binary, better OS integration than the Electron-style approach), graceful degradation when running with limited cluster permissions, and dynamic discovery of Prometheus or VictoriaMetrics endpoints.
Native desktop app built on Wails v2
Graceful RBAC degradation for limited-permission clusters - features disable cleanly instead of erroring
Dynamic Prometheus / VictoriaMetrics service discovery - no manual endpoint config
Multi-select namespace filter and OIDC kubeconfig auth
Filter the cluster view by any combination of namespaces, and connect to clusters whose kubeconfig uses OIDC (or other auth-provider plugins) without surgery.
Multi-select namespace filtering across topology, resources, and events
OIDC and other auth-provider support in kubeconfig parsing
Windows distribution: Scoop and PowerShell installer
First-class Windows install paths: a Scoop bucket for the CLI and a one-line PowerShell installer for users who don't want to add a package manager. macOS and Linux already had Homebrew, Krew, and a curl-able install script.
Browse the contents of any container image without pulling it locally - layer breakdown, file tree, file contents. Useful for spotting what's actually in a base image, debugging COPY ordering, or checking if a binary made it in.
Radar reads from your GitOps controller and shows what's actually deployed vs. what's declared. Plus a few related shipping items in the same window: workload-level log viewing and generic CRD topology via owner references.
ArgoCD and FluxCD application/source tracking
Workload-level log viewing (v0.7.5) - one log stream across all pods of a Deployment
Generic CRD topology via owner references (v0.7.7) - works for CRDs Radar has never seen
A single landing view that surfaces cluster health, recent events, and quick navigation - plus dedicated renderers and consistent iconography for every Kubernetes resource kind. Day-after follow-up (v0.6.4) added metrics charts and a metrics-history endpoint to the dashboard.
Helm chart deploy and service traffic visualization
Two foundational features: ship Radar into your cluster via a Helm chart, and see service-to-service traffic in the topology view (the precursor to the L7 Hubble integration that landed in March).
Helm chart for in-cluster deployment
First service traffic visualization on the topology canvas
Real write actions from the UI - delete, restart, trigger or suspend a CronJob - plus a unified event timeline that pulls from all sources into one chronological stream. Argo Rollouts is rendered properly too.
First public release. Apache 2.0 licensed, runs locally as a desktop app or kubectl plugin, talks to your cluster from your machine - no agents, no account, no telemetry.
Topology view with hierarchical grouping and filter sidebar