

If traffic is sent toward this resource, does it reach a healthy process - and if not, which hop is the first to break?Available in Radar v1.9.1+ (the in-cluster probe test also requires the probe image from v1.9.1+). Naming note: this is NOT the AI Investigations feature - Reachability is deterministic path tracing and live probing, no AI involved. The general-purpose MCP
diagnose tool returns a bounded, point-in-time evidence bundle for a narrowed workload or reconciler, and returns this reachability trace when pointed at a network entry kind - see MCP.
The trace has two layers:
- Static - is the path wired correctly in config + current pod state? Pure functions over the in-memory informer cache, no per-call API requests. Always on.
- Active reachability test (optional, one-shot) - send DNS / TCP / TLS / HTTP probes along the declared path and report what came back. HTTP-shaped ports get an HTTP request; explicitly non-HTTP ports stop at TCP rather than sending an unrelated protocol. The proxy probe runs automatically once when the Reachability tab opens (re-runnable via Run test); only the in-cluster Job test stays a manual click.
Mental model
ingress-a and ingress-b does not become broken when only one of them fails - the other still delivers traffic. The verdict only degrades to broken if every upstream is broken, degraded if some are.
Downstream is a chain. The first critical finding along Downstream is the broken hop, named brokenAt. Findings on later hops are still shown but the diagnosis starts at the first failure.
Supported entry kinds
Other network surfaces in the topology (Traefik IngressRoute, Istio VirtualService, Knative) are deliberately out of scope today - they would each need their own resolution logic and aren’t reached by the same
parentRefs / backendRefs shape.
What each hop carries
Every hop has:- A resource reference (kind, namespace, name) and an edge label (e.g.
HTTPRoute->Service) so the path reads top-to-bottom in the traffic direction. - Findings - the detections that already exist in the issues pipeline, attached to the hop where the failure is observable. The Phase 0 additions to this pipeline:
gwroute:backend-port-mismatch- an HTTPRoute / GRPCRoute references a Service port that doesn’t exist.- Gateway-API route parent conditions (
Accepted=False,ResolvedRefs=False,Programmed=False) - read directly fromstatus.parents[]so the controller’s own verdict is the source of truth.
- Meta - pod counts (
selected/ready),endpointSource: pod-readiness,headless, andselectorlessflags so the UI can render the right shape without re-deriving them.
Reachability test (active probes)
The proxy-vantage test runs automatically when the tab opens and is re-runnable via Re-run reachability test; the Test in-cluster button (consent-gated - the dialog names the exact requests the probe pods will send, e.g. “TCP connection to redis-master:6379”) runs the probe Job. Each run fires one round of applicable probes. HTTP(S) routes use their declared path; non-HTTP Service ports have no HTTP path and stop at TCP:
Each row reports outcome (
ok / fail / skipped), latency, the path it traversed (pod-to-pod path or via Kubernetes API), and an HTTP status detail when available. The total budget is 3 seconds; per-hop runs in parallel within that envelope. Probes are an action, not a polling state; the button fires once, results land, the next static refetch replaces them.
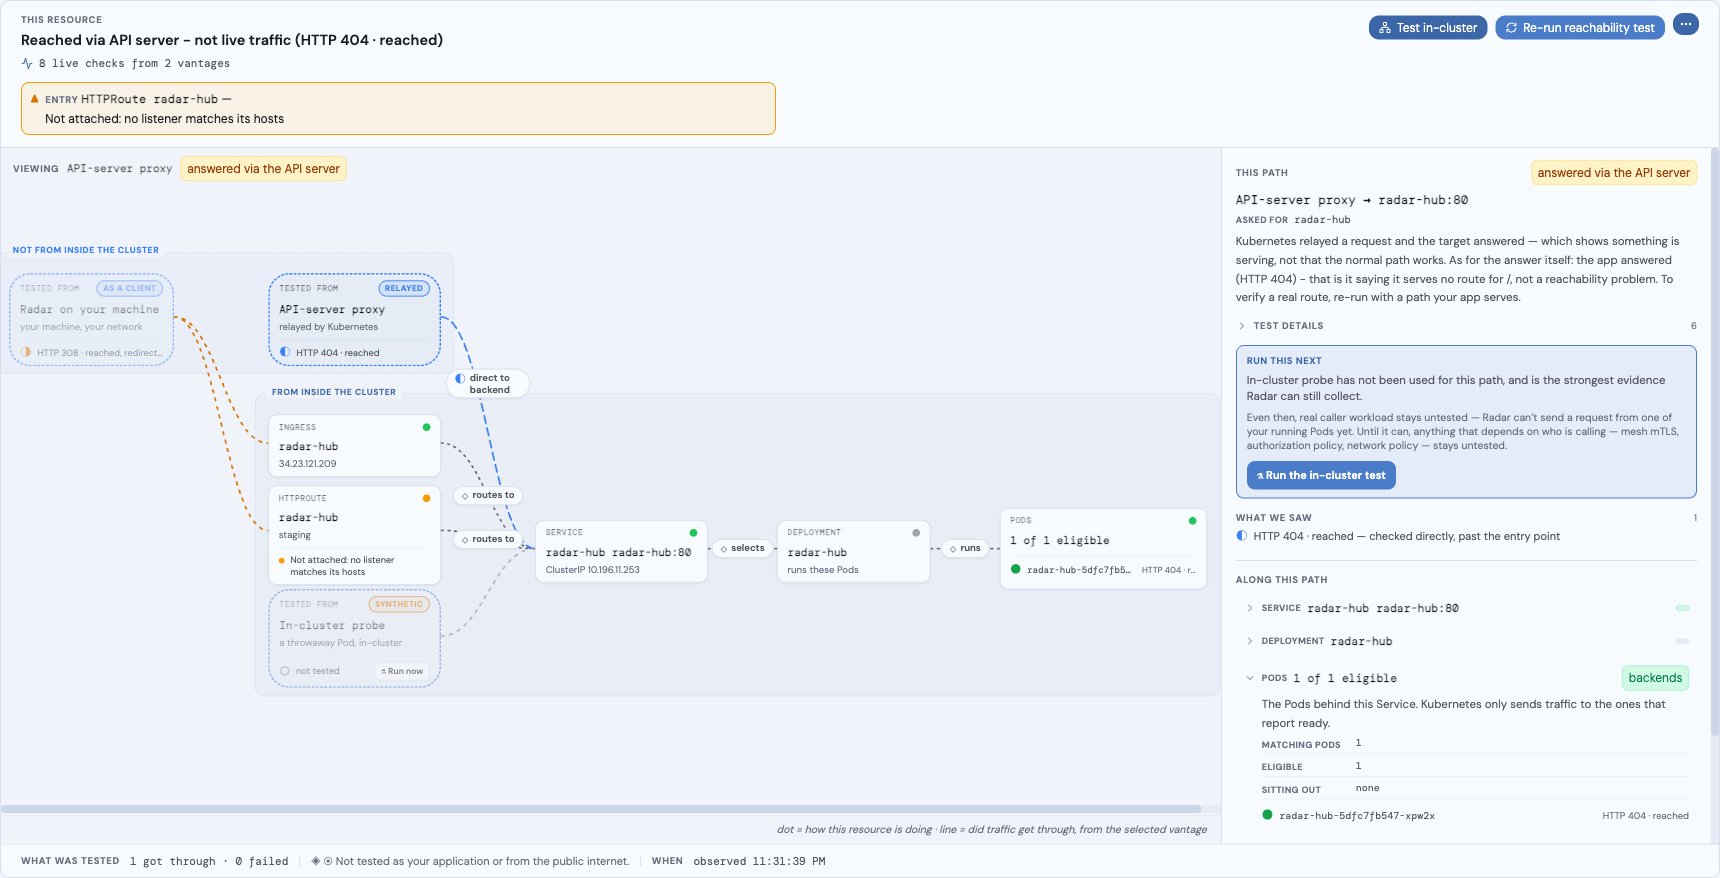
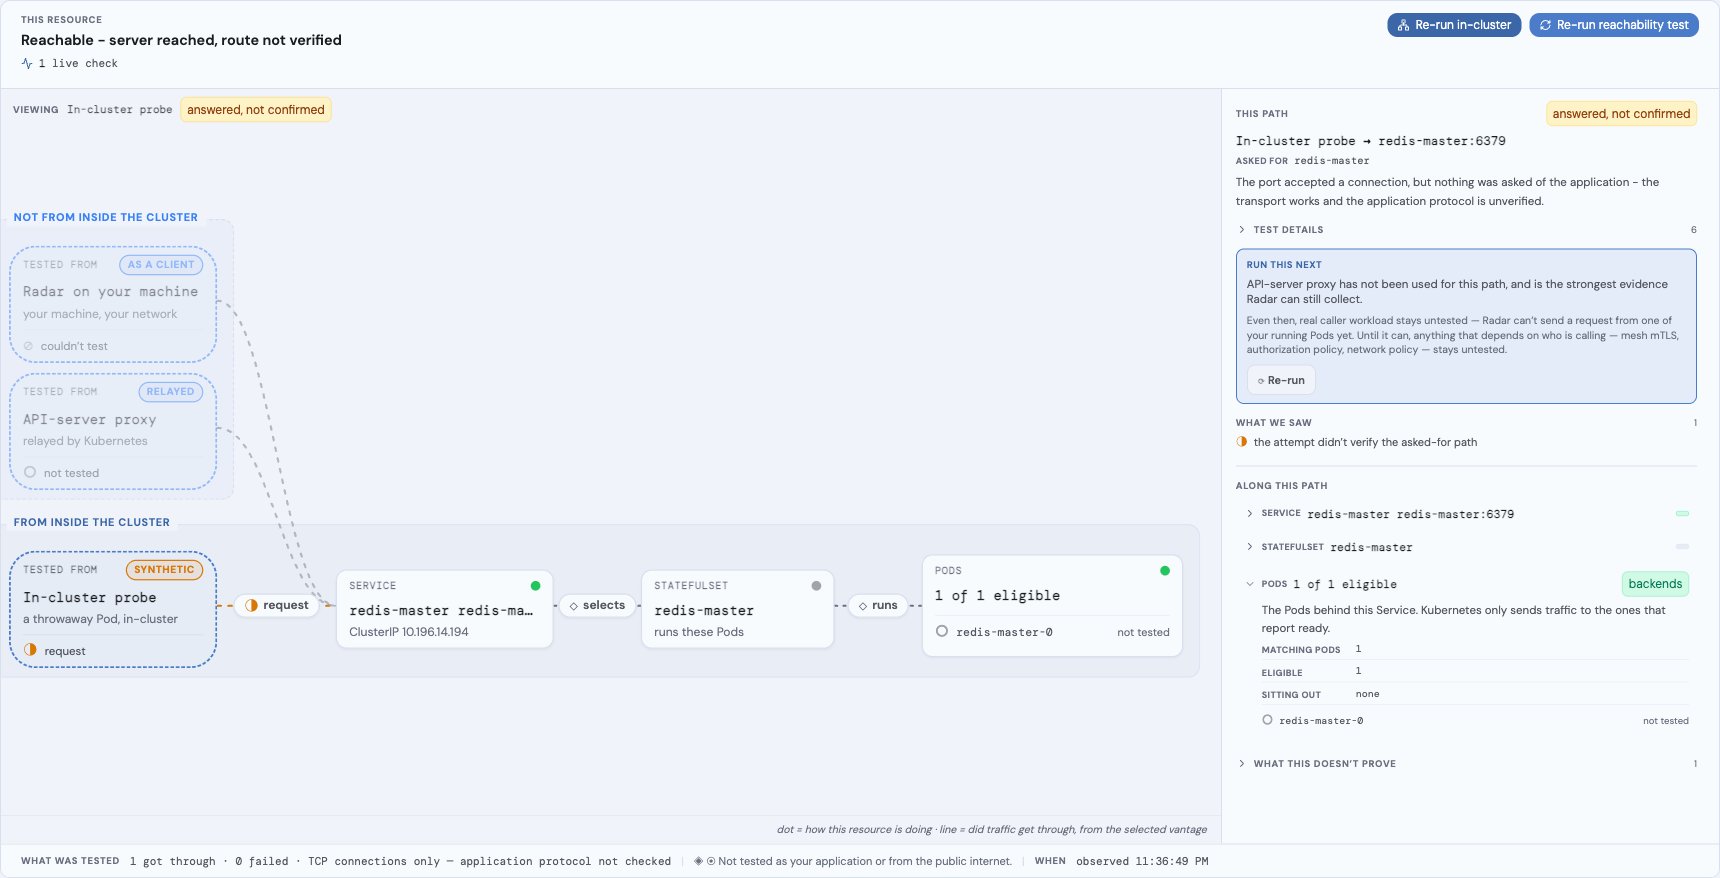
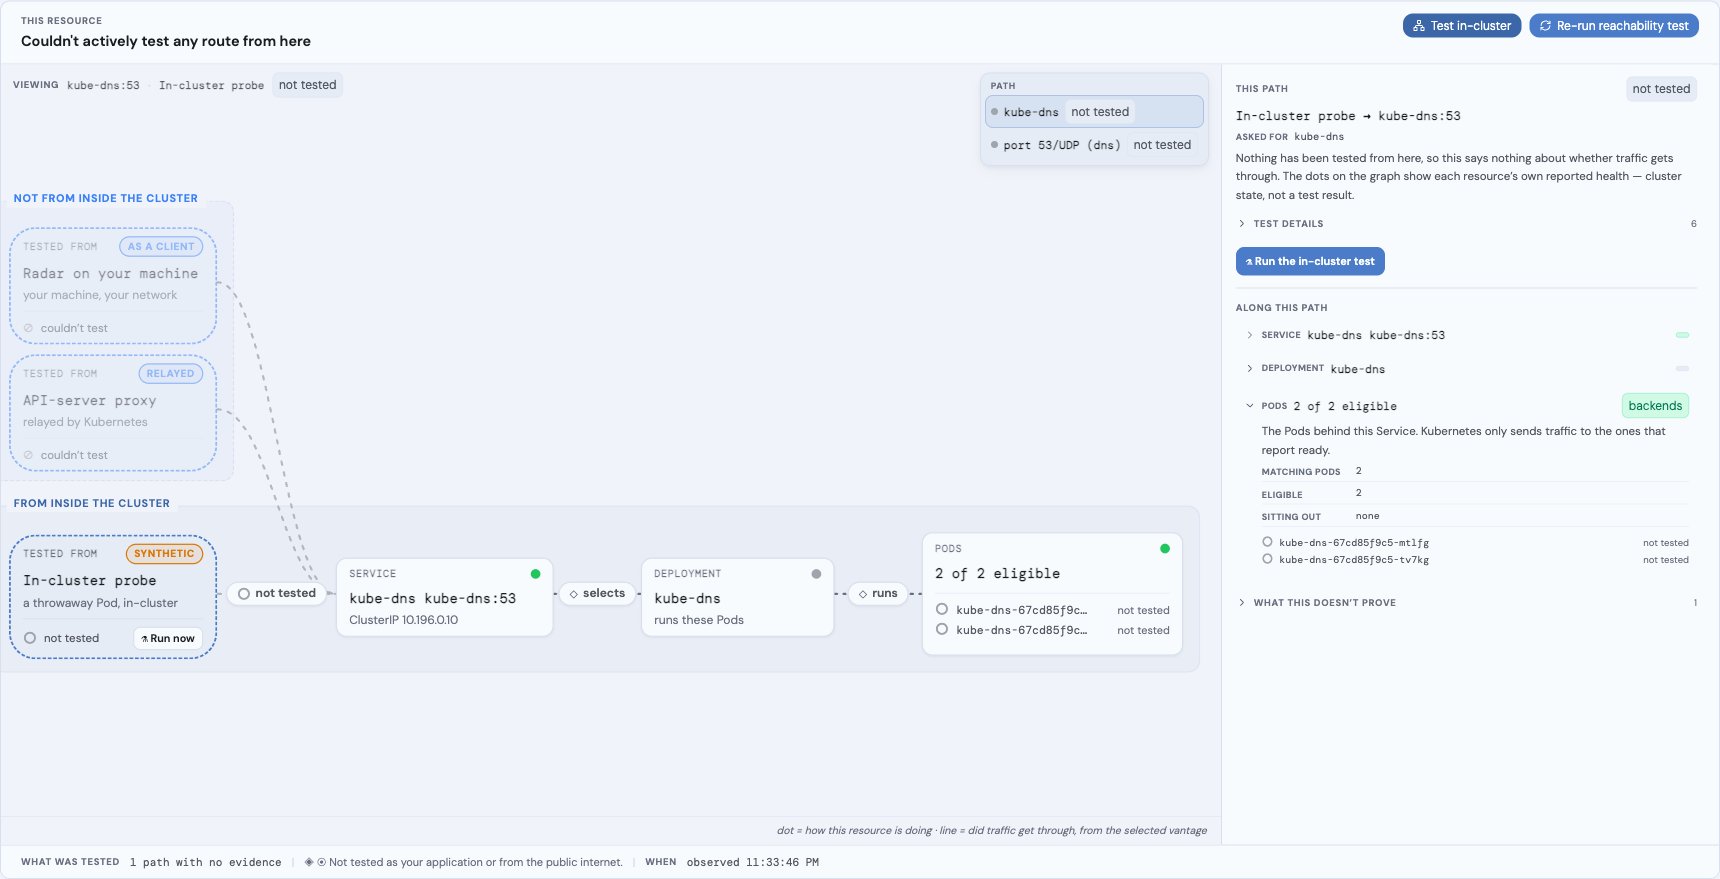
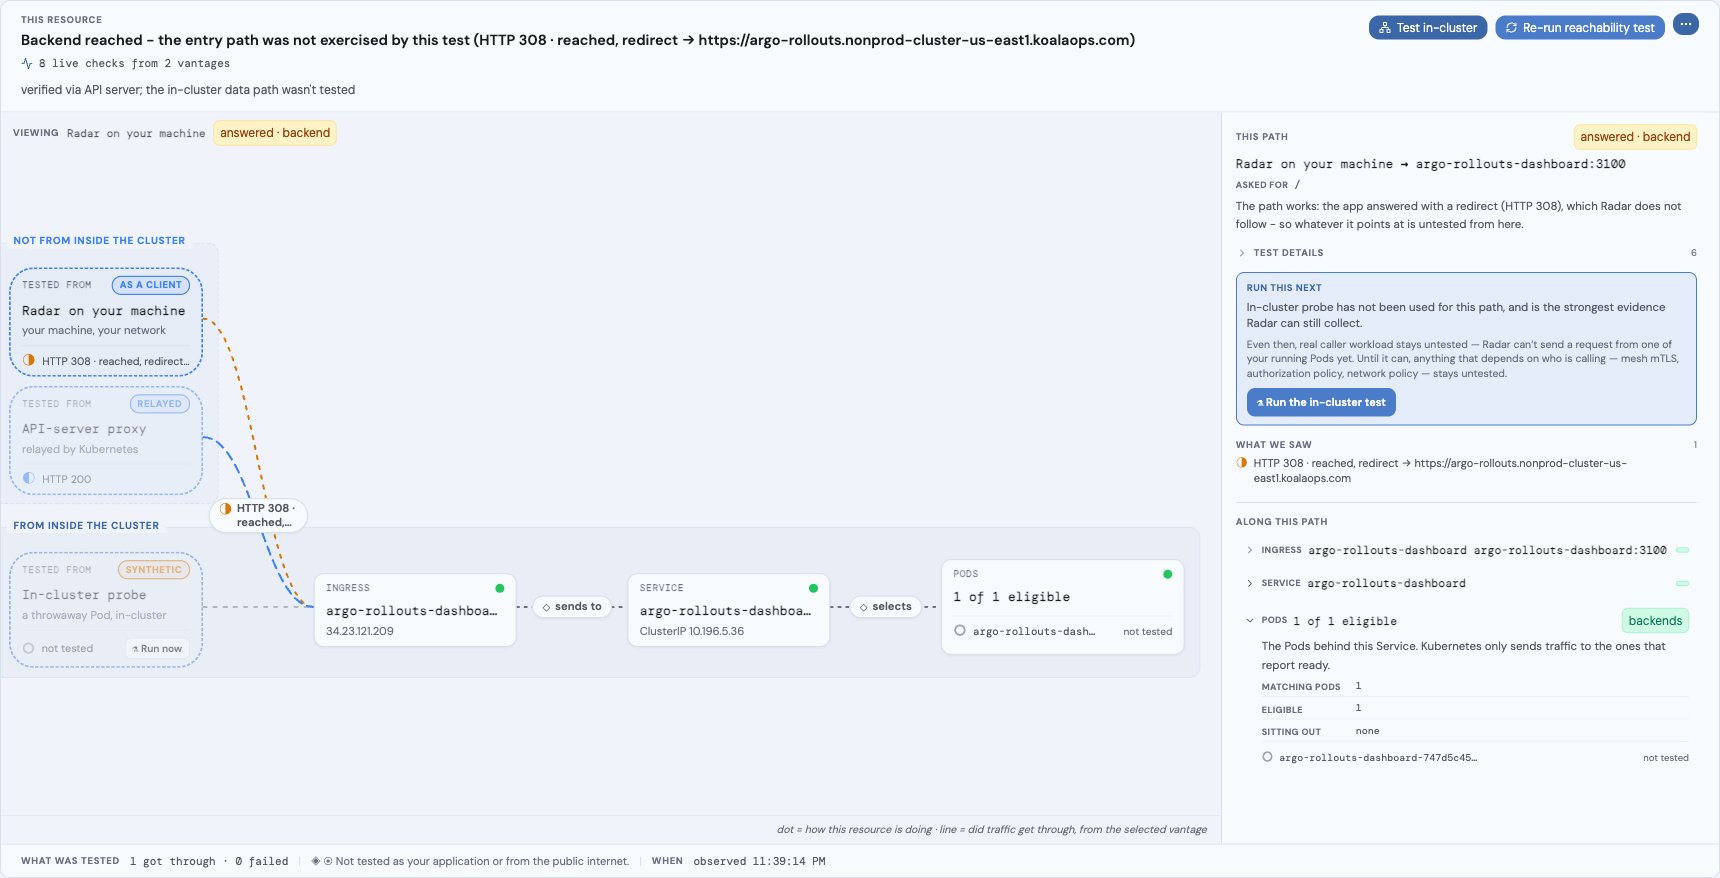
Vantage is a first-class concept in the UI. A reachability result is meaningless without knowing where the request came from, so the tab is built around two explicit selections: WHICH path (the PATH picker on the graph - one row per declared route, with per-port protocol labels like port 53/UDP (dns) when a Service declares dual-protocol or non-HTTP ports) and FROM WHICH vantage (selectable capsules on the graph: Radar on your machine dialling as a client, the API-server proxy relay, and the in-cluster probe). Selecting a vantage genuinely re-routes the graph and re-scopes the verdict, the edges, and the inspector - a laptop’s success is never painted onto the in-cluster lane. Vantages Radar cannot use (a real caller workload, a genuine external client) stay visible as stated gaps rather than being hidden, so synthetic evidence never looks complete.
Every claim on the page carries its evidence: the verdict band states the live-check volume (“8 live checks from 2 vantages”, with the DNS/TCP/TLS/HTTP breakdown on hover), a skipped route states WHY it was skipped from the exact vantage that skipped it, and node dots show each resource’s own health - cluster state, never a test result (edges carry the test truth).
Security model
Relayed and Job-based probes are bounded by Kubernetes RBAC, but they do not always use the same namespace:
With authentication enabled, Radar uses the signed-in user’s identity. Without authentication, Kubernetes-authorized probes use Radar’s own client identity: your kubeconfig identity locally, or Radar’s ServiceAccount when it runs in-cluster. The API server enforces relay permissions at request time; Radar preflights all three Job permissions before creating anything. If impersonation is unavailable, the relay is skipped rather than falling back to Radar’s ServiceAccount. A proxy denial can mark that route unreachable via the API server, but the headline stays unknown because the real path was not confirmed.
The UI asks before the first in-cluster run for a cluster and names the requests it will send (unless that consent was previously remembered). MCP has no dialog: callers must explicitly pass
in_cluster: true, and the same RBAC preflight applies. Radar Cloud also requires org role Member or higher.
The active Kubernetes identity authorizes Job creation, but network and mesh policy see the probe pod, not that identity. The Job runs in the diagnosed resource’s namespace; its pod uses that namespace’s default ServiceAccount identity but mounts no ServiceAccount token. Each run creates at most five Jobs; their containers run non-root with a read-only filesystem, all capabilities dropped, a 25-second deadline, no retries, and a 60-second TTL backstop.
The default Helm chart grants neither proxy-subresource access nor Job creation, so those probe paths stay unavailable unless the relevant identity receives the permissions above. Radar running in-cluster can still dial directly from its own pod. The full /mcp endpoint also exposes RBAC-bounded write tools; /mcp-readonly excludes apply_resource, patch_resource, and the manage_* tools while retaining diagnose. On /mcp-readonly, the in_cluster argument is not exposed and schema validation rejects it.
Agent boundary
/mcp-readonly gives agents typed tools with fixed schemas, not a kubeconfig or shell. With authentication enabled, Kubernetes operations are bounded by the signed-in user’s RBAC: direct cluster operations run under impersonation, while cache-backed reads apply per-user authorization checks. Without authentication, operations use Radar’s own Kubernetes identity. The typed tool surface independently limits which operations the agent can request.
What it deliberately does NOT do
- No EndpointSlice reads. The endpoint signal is pod-readiness; the trace marks this with
endpointSource: pod-readinessso the approximation is honest. - NetworkPolicy is predicted, never enforced by us. Radar checks the ingress rules of core NetworkPolicies that select the subject’s pods, without assuming a particular client (caller-independent). When no rule admits the path’s port it surfaces “a cluster network rule would block traffic to these pods” WARNING prediction; when a rule allows the port only from specific sources it surfaces a source-restricted advisory (Radar can’t tell from its own vantage whether your caller is allowed); an egress-only policy becomes an outbound note. This is always a PREDICTION, not a verdict - the CNI is the only authority on enforcement (some plugins write the NetworkPolicy object but enforce nothing), so a successful live in-cluster probe downgrades the prediction when real traffic got through, while a failed probe does not by itself prove that a policy was the cause. We do not model CNI-specific enforcement behavior. For a connection that was actually dropped, the Traffic view’s per-flow panel is the place to look: with Hubble it shows the reason the plugin reported and, for policy drops, what Radar can determine from the current Kubernetes NetworkPolicies for that recorded flow (see “Why was this flow dropped?” on the Network Policies integration page).
- No external-path probing for Service type LoadBalancer / NodePort - the external path requires modelling cloud LB state honestly and is intentionally out of scope today. (ExternalName is probed: Radar DNS-resolves and HTTP-reaches the alias host from its own vantage, marked indirect - a reach from Radar’s network is not proof of in-cluster reachability.)
- No new CRDs. Everything reads from the same informer cache the rest of Radar uses.
Limits - when an active probe can fail on healthy traffic
A probe reports what Radar’s vantage observed. Real traffic can flow fine while a probe fails, for reasons that have nothing to do with the workload:- Service mesh mTLS (Istio / Linkerd / Consul). A mesh with strict mTLS rejects any connection without a valid mesh client certificate. A probe from your laptop (or any caller outside the mesh) has no such cert, so the TLS/HTTP layer fails even though sidecar-to-sidecar traffic is healthy. Recognize it: the pods carry a mesh sidecar (
istio-proxy,linkerd-proxy) or mesh labels (istio.io/rev,linkerd.io/inject). Trust real in-mesh traffic over an out-of-mesh probe. - NetworkPolicy. A policy can allow real workload-to-workload traffic while blocking Radar’s API-server-proxy identity (or the reverse). A failed probe next to healthy config is often this. The trace statically predicts a would-block from the caller-independent ingress rules, but the CNI is the only enforcement authority - so the prediction is confirmed or downgraded only by the live in-cluster probe.
- DNS split-horizon. A probe resolves hostnames from your vantage, not the cluster’s. An internal name that resolves inside the cluster may not resolve (or may resolve differently) from your laptop; those probes skip with a reason rather than failing.
- API-server relay limits. The relay may be denied or unable to dial an internal-only address. That result describes the relay vantage, not the workload’s real traffic path.
diagnose(in_cluster: true)) to probe from the real dataplane, where mesh certs and in-cluster DNS apply.
Verdict semantics
The verdict is a coverage claim over the intended routes - what was actually tested, not what the config implies. It judges ONLY the intended traffic route: an API-server-proxy probe can localize a failure but never sets the headline - only a real-traffic (data-path) result does. Each tested route carries an outcome and a confidence:
The route outcomes roll up to the verdict:
A real-traffic
reached non-2xx (e.g. a 404) reads as healthy coverage with a qualified headline - “server reached, route not verified”: the network path is reachable, but the route itself isn’t confirmed.
verdict is therefore a coarse rollup, not a promise of a verified 2xx. healthy means “no failing route was found” - it can include routes that were only reached (a 3xx/4xx, or a transport-only TCP/TLS connection) rather than verified, and can reflect a static-config-only assessment (probe=false) or partial coverage. Agents (and the MCP diagnose tool’s verdict field) that need certainty must read each route’s outcome (verified vs reached vs not-tested) and confidence (real vs indirect) plus the headline / diagnosis text before keying an action on verdict alone.
The UI shows the verdict at the top of the panel with a one-sentence reason. Treat unknown as a pause-and-investigate signal - it means the trace can’t honestly answer the question, not that everything is fine.
MCP
The general-purposediagnose MCP tool collects a bounded, point-in-time evidence bundle for a narrowed target; it does not run an agent or promise a root-cause verdict. For network entry kinds it returns this reachability trace instead of the pod-log fan-out used for workloads. An agent that calls diagnose(kind=service, ...) gets the path-shaped answer in one call, along with relatedIssues for raw-issue follow-up. Pass probe: true to add the active reachability test from Radar’s vantage. Pass in_cluster: true to run the probe from inside the cluster - Radar creates up to 5 short-lived, self-destructing probe pods (one per intended route) under the active Kubernetes identity’s RBAC to test the real dataplane the API-server-proxy vantage can’t reach (e.g. to confirm a route that came back indirect). This is the only mutating diagnose option; it needs create jobs, list pods, and get pods/log, and falls back to a copyable command when any permission is missing.
In-cluster probe image
The in-cluster test runs a short-lived Job whose container executesradar probe. Radar resolves which image that Job uses, most-trusted first:
- Explicit override -
--reachability-imageflag /reachabilityImageconfig. Always wins. - Self-read - radar’s OWN running pod image, read from
MY_POD_NAME/MY_POD_NAMESPACE(downward API) using radar’s service account. The honest default: the probe runs the same image as radar, so it’s automatically correct for private registries, mirrors, and digest-pinned deploys. RADAR_IMAGEenv - the Helm chart sets this to radar’s deployed image; a no-RBAC fallback for when self-read can’t run.- Version-matched published image -
ghcr.io/skyhook-io/radar:<version>, where<version>is radar’s own build version.
/radar (the Job runs ["/radar","probe",...]) - every official radar image does.
By deploy shape:
- Standalone (Helm chart): self-read or the chart’s
RADAR_IMAGEresolves radar’s deployed image. Nothing to configure. - Cloud agent (
--cloud-url): radar runs in-cluster as its own image; self-read resolves it. Nothing to configure. - Embedded in another app: embedding only the frontend library (e.g. Radar Hub) is unaffected - the backend is still a real radar image. If radar’s backend is wrapped inside a non-radar image, self-read returns that host image, which only works if it ships
/radarwith theprobesubcommand; otherwise set--reachability-image/RADAR_IMAGEto a published radar image. If neither is valid the probe pod fails honestly (a clear “couldn’t start” status + a copyable command), never a wrong result.
-dirty local build’s version isn’t a published tag, so the default (#4) won’t exist. Build a probe image from your code and load it into kind:
Performance
Static trace:- No per-call API requests; pure functions over the in-memory informer cache
- Linear in path length + selector match counts, which are bounded by the cache contents
- Target <100ms typical, <300ms on a 200-pod namespace
- Five-second polling from the UI while the Reachability tab is open; data is cached client-side so retabbing within the drawer is instant
- Budgeted at 3 seconds total; per-hop probes run in parallel within that envelope
- Each layer respects a strict per-call timeout (DNS 250ms, TCP 700ms, TLS 1s, HTTP 1s) so a single dead hop can’t starve the rest
- Triggered by an explicit operator click; no polling, no sticky on-state