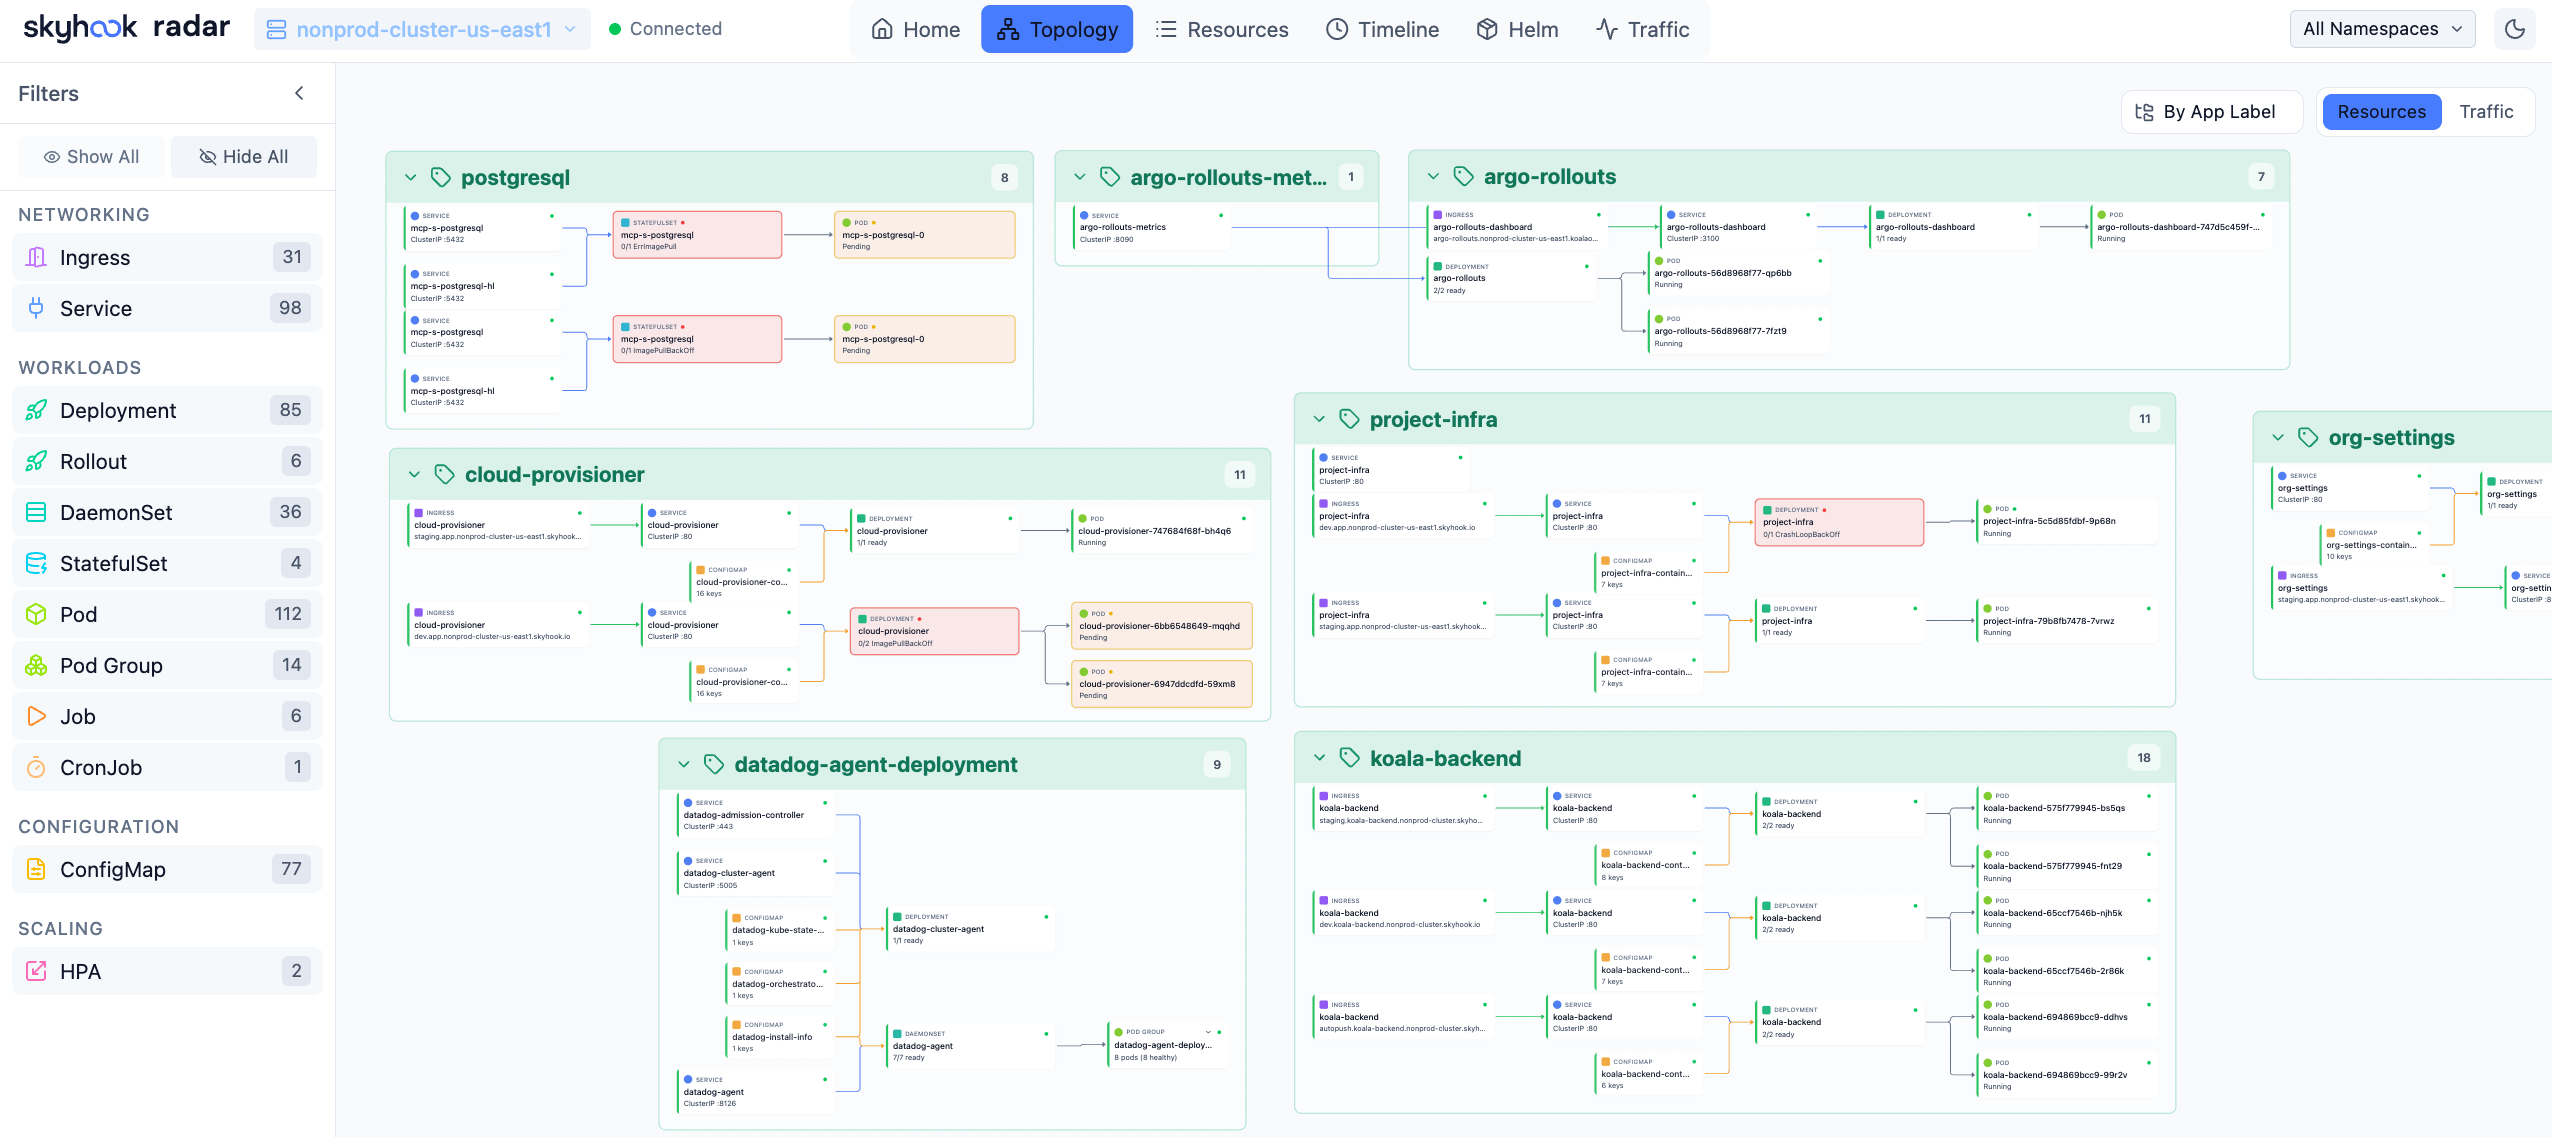
What’s on the graph
- Workloads - Deployments, StatefulSets, DaemonSets, ReplicaSets, Jobs, CronJobs, Argo Rollouts.
- Services - ClusterIP, NodePort, LoadBalancer, ExternalName.
- Networking - Ingresses, Gateways, HTTPRoutes, NetworkPolicies, Istio VirtualServices, Traefik IngressRoutes, Contour HTTPProxies.
- Configuration - ConfigMaps and Secrets edge in via volume / env references.
- Storage - PVCs / PVs.
- Autoscaling - HPAs, KEDA ScaledObjects.
- GitOps - Argo Applications and Flux Kustomizations / HelmReleases group their managed resources.
- Cluster scaling - Karpenter NodePools and NodeClaims, with the nodes they bring in.
- Custom resources - any CRD discovered at runtime.
Two modes
Switch in the top right:- Resources - the structural graph: ownership, label selectors, ingress backends. This is the default and is read entirely from the K8s API.
- Traffic - overlay live request flows on the same graph. Requires traffic source (Hubble / Caretta / Istio). Edges thicken with throughput and stay thin / dashed when no traffic was observed in the window.
Interactions
Filters
The left rail filters the graph by kind, namespace, and label. Pinned kinds (set in Settings → Pinned kinds) appear at the top of the kind picker for quick toggling. When you switch namespaces, Radar doesn’t tear down the graph - it dims out-of-namespace resources and keeps the layout stable.Layout & performance
Radar uses a force-directed layout with fixed seed positions per kind, which keeps the same workload in roughly the same place across page loads. For very large clusters (thousands of pods), Radar collapses ReplicaSets under their parent Deployment by default - expand a node to see individual pods.Audit badges
High-signal Cluster audit findings - a dangling reference, a Service with no endpoints, a deprecated API - badge the affected node directly on the graph, so a genuinely broken resource stands out without opening the audit view. The full per-resource breakdown still lives in Cluster audit.What’s not on the graph
- Events - those live in the Timeline.
- Cross-cluster relationships - per-cluster only today.
See also
- Resource browser - the table view of the same data.
- Traffic visualization - turning on Hubble / Caretta / Istio.
- Integrations & CRDs - which CRDs contribute edges.