Issues vs Cluster audit
These are two different axes, and Radar keeps them separate on purpose:- Issues = live operational state. Is this resource failing, right now? A crashing pod has an Issue.
- Cluster audit = static best-practice / security posture. Is this resource configured well? A healthy pod can have many audit findings; a crashing pod can have zero.
get_events. Kyverno PolicyReport violations surface per-resource, not in either stream - see Kyverno.
What it catches
Every Issue carries asource label - problem, missing_ref, scheduling, or condition - so you can slice or CEL-filter the stream. This is the catalog the detectors cover today.
Failing and stuck workloads (problem)
- Crash and restart loops - CrashLoopBackOff, high restart counts, OOMKills.
- Image pull failures - ImagePullBackOff, including a missing
imagePullSecret. - Probe failures - failing or misconfigured liveness / readiness probes.
- Under-replicated rollouts - Deployments / StatefulSets below desired (
ReplicaFailure,MinimumReplicasUnavailable, “0/N replicas”),ProgressDeadlineExceeded/ ReplicaSets timed out progressing. - Argo Rollouts stuck or failed.
- Jobs and CronJobs - backoff limit exceeded, a Job that created no pod (e.g. quota), a CronJob whose env references a missing Service.
- Never-started - init container stalled, pod created but never ran, a workload scaled to 0 that something still selects.
- Stuck terminating - resources past their deletion window, naming the finalizers still holding them and the controller responsible.
- Helm releases - native Helm install / upgrade failures (and failed-hook rollbacks) surface as Issues next to the workloads the release manages, and reach AI agents over MCP.
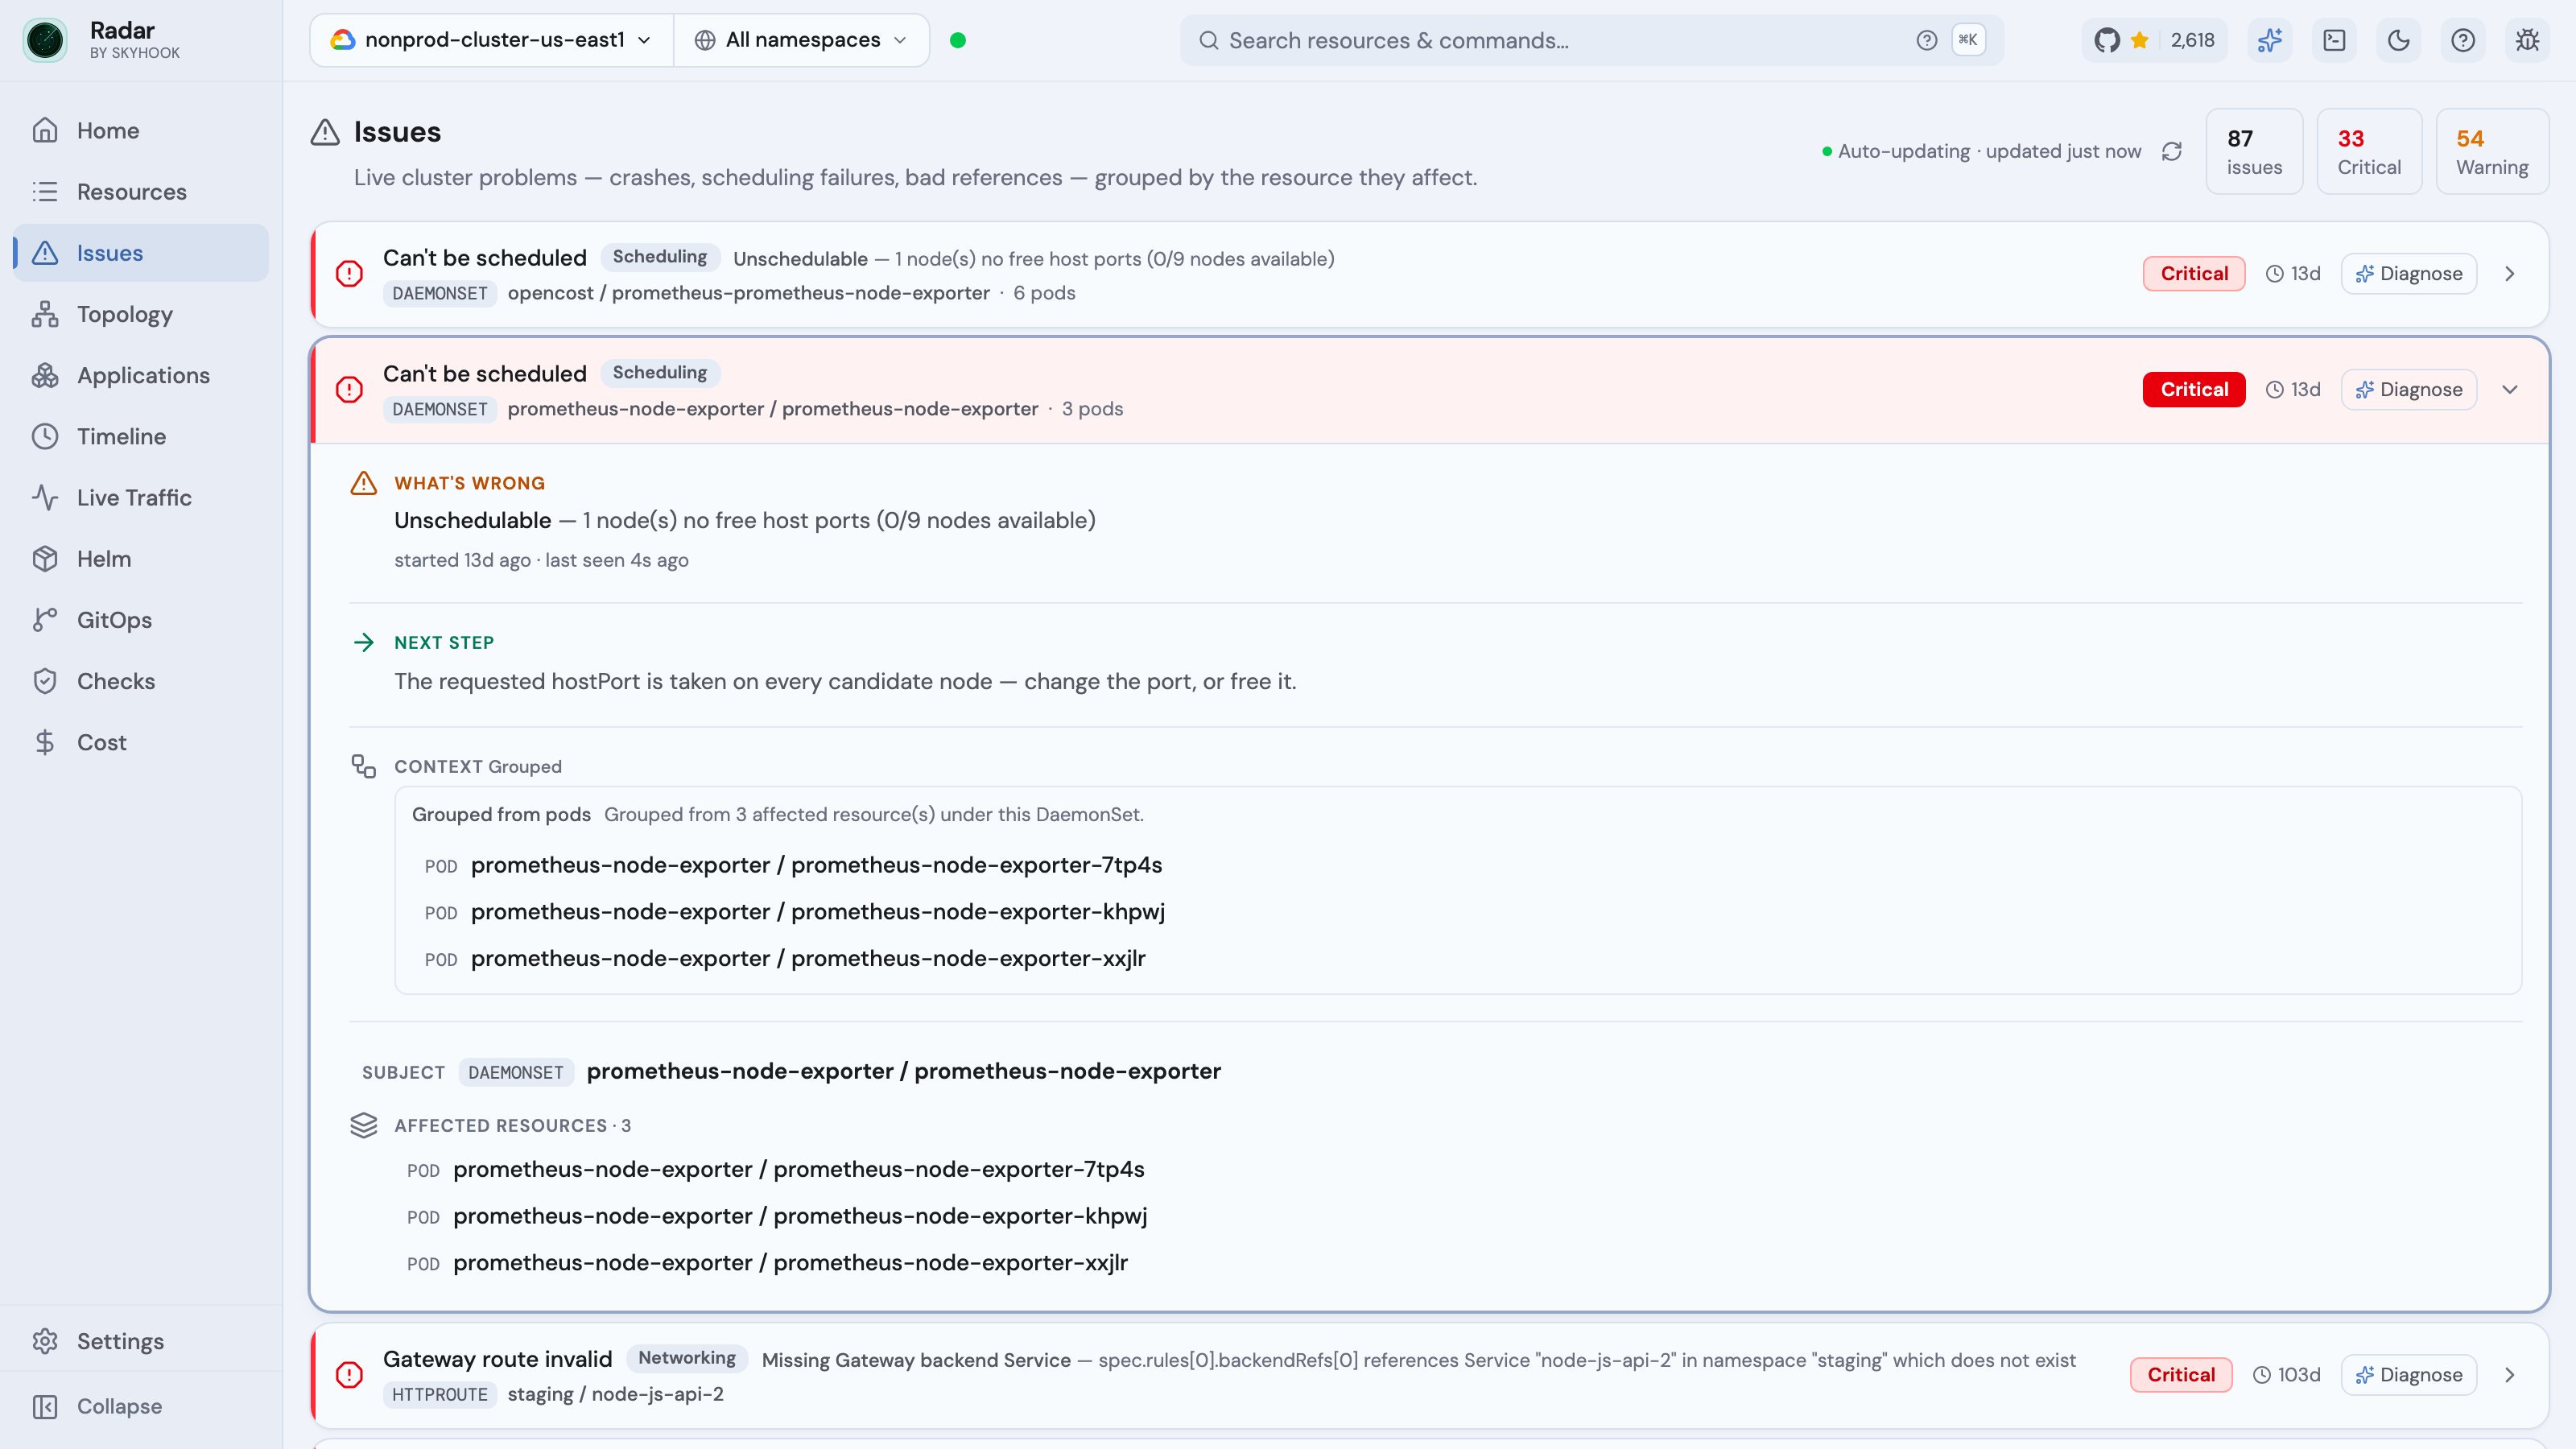
Pods that can’t start (scheduling)
The specific reason a Pod can’t reach Running, not a generic “Pending”:
- Unschedulable - insufficient CPU / memory / resources, untolerated taints, node-affinity / pod-affinity / anti-affinity / topology-spread that no node satisfies (Radar resolves which label or expression failed and how many nodes matched), or non-empty scheduling gates.
- Admission-rejected - ResourceQuota exceeded, LimitRange violation, Pod Security Admission violation, or a validating / mutating webhook denial.
- Stuck post-bind - bound to a node but wedged on sandbox / CNI creation or volume attach / mount (including multi-attach on a ReadWriteOnce volume).
Dangling references (missing_ref)
Wiring that points at something that doesn’t exist - a frequent, easily-missed root cause:
- Pod → missing ConfigMap, Secret, ServiceAccount,
imagePullSecret, or TLS Secret. - HPA / KEDA ScaledObject → missing
scaleTargetRef. - Ingress → missing backend Service or Service port.
- Gateway API route → missing backend Service, backend port, or ReferenceGrant.
- Service wiring → StatefulSet missing its headless Service, a Deployment with no Service when its peers have one, an Argo Rollout missing its Service, a named
targetPortno pod exposes, or a selector matching no pods. - RoleBinding → missing
roleReftarget (Role / ClusterRole). - Validating / mutating webhook → missing backend Service.
- PVC → missing StorageClass.
Storage and networking health (problem)
- PVCs - unbound (no volume provisioned), bound volume lost, ReadWriteOnce volume shared across replicas, volume-resize failures.
- Services - type LoadBalancer with no external address assigned (stuck pending).
- PodDisruptionBudget blocking voluntary evictions, so drains and node upgrades wedge.
Failing operator conditions (condition)
False status conditions on operator-managed CRDs, in the same stream as native failures so a broken Application sits next to the workload it affects:
- GitOps - Argo CD Degraded health, last sync failed, OutOfSync drift, stuck drift loops, comparison errors; Flux artifact / install / reconciliation failures.
- cert-manager - certificates not available / not ready.
- KEDA - scaling inactive.
- Gateway API - a Gateway not Accepted / not Programmed, or an HTTPRoute / GRPCRoute not Accepted or with unresolved backend refs on a specific parent Gateway and listener.
- Knative, Crossplane, and other operators -
Ready=Falseconditions surfaced generically. - CRDs and APIServices - a CustomResourceDefinition that failed to establish (name conflicts) or an aggregated APIService that’s unavailable.
- Cluster API - Cluster or Machine in a Failed phase, control-plane / infrastructure / bootstrap not ready, remediation blocked.
Node and cluster health (problem)
- Nodes - MemoryPressure / DiskPressure / PIDPressure, NotReady, cordoned (SchedulingDisabled).
- Version skew between kubelets and the control plane.
- Suspicious CoreDNS config - a Corefile rule that can override Kubernetes service DNS (NXDOMAIN override / service-DNS rewrite), a quiet way in-cluster resolution gets hijacked.
Triage context
Some rows carry deterministicdiagnostic_context - the explicit missing reference, the selected backend’s problem, a workload rollup. Treat it as triage signal, not proof of root cause.
A critical Issue is also correlated against recent changes: Radar binds it to the specific spec/config edit that may explain it, or marks it as having no recent changes - so you can rule a config change in or out instead of guessing. The change feed it draws from coalesces a delete-and-recreate of the same object into a single “recreated with changes” diff (rather than a contentless add/delete pair) and surfaces edits that often hide, like a ResourceQuota or LimitRange tightening. As with diagnostic_context, treat correlation as triage signal, not proof of root cause.
Radar also draws causal links across resources, so you see a blast radius instead of triaging each symptom alone: a memory-pressured or NotReady node links to the pods it’s taking down, and a failing PVC links to the workloads stuck on it. Each link carries a confidence (high / medium / low), and the links are non-destructive - the underlying Issues stay in the stream on their own.
Where it appears
- Home dashboard - the Issues band ranks the cluster’s current failures the moment you open Radar.
- Grouped triage - Issues are classified and grouped by subject so a single failing app doesn’t produce twenty separate rows.
- Inline on resources - an affected resource shows its Issue in the detail drawer, cross-linked to the related resources.
AI access
The MCP server exposes the same stream as the read-onlyissues tool - “what’s broken right now,” ranked, with the source labels and diagnostic_context above. It’s deliberately distinct from get_cluster_audit (posture) and get_events (raw events). See the MCP guide.