

kubectl get nodeclaims, controller logs, and scheduler events. It never mutates anything.
When it appears
Capacity is always in the sidebar (next to Cost, shortcutg p), and the Overview renders on any cluster. The page requires cluster-level node visibility; Karpenter access adds the deep screens. The Karpenter-specific screens (NodePool detail, Demand, Activity) and every Karpenter bridge require the integration: NodePools discovered and listable by your identity. When NodePools exist but your identity is denied them, the Overview still renders its cluster-only shape with an honest coverage banner, while the Karpenter screens fail closed - and the 403 is actionable: it names what remains visible without the grant and carries a copy-pasteable ClusterRole with exactly the permissions to request. Both karpenter.sh/v1 and v1beta1 work, including provider NodeClasses (EC2NodeClass, AKSNodeClass, and friends).
The four screens
Overview
The recurring posture check:- KPI tiles - Capacity managers (each detected manager with a worst-of health rollup), Node groups (the unified inventory count, with Karpenter readiness as the detail), Nodes (total observed, with a pooled/unattributed breakdown), NodeClaims with a lifecycle rollup (“8 ready · 1 launched · 1 failed · +1 orphaned”) on Karpenter clusters, and Pending pods.
- Cluster scheduling capacity bar - all observed nodes, per resource: scheduled requests fill the allocatable track to scale; Karpenter in-flight claim capacity extends beyond the allocatable edge (capacity that will exist once claims register, never capacity the scheduler can use today); pending demand is a count chip after a
//break, deliberately not to scale - demand can exceed the whole fleet. A resource the fleet does not have reads “0 requested of 0 allocatable · N pending” - the GPU-pool-missing story in one line. - Operational signals - prioritized findings (limit pressure, registration health, blocked disruption, pending demand), each linking to its diagnosis. A cascade collapses to its root cause: a broken NodeClass reads as one incident, not as a peer warning on every pool that references it.
- Node groups inventory - every logical group across every manager, with nodes, allocatable, scheduled requests, and a typed scaling story (“5-11 nodes · target 9”, “bounds not published in-cluster” - never a bare dash). Each row carries its platform identity (the label that makes the row exist), kept distinct from its autoscaler: “None detected” appears only when the autoscaler status was actually observed and named no manager; an unreadable or denied source reads “Detection unavailable” instead. Karpenter rows carry readiness and link into the NodePool detail; autoscaler-managed rows expand into the per-zone groups (MIGs / VMSS) as the autoscaler itself reports them: min-max, target, health, backoff, and the autoscaler’s own probe time.
- Known to the autoscaler, unattributed - groups the autoscaler reports that no observed node joins. Scale-to-zero groups live here until nodes appear; they are never counted as logical groups.
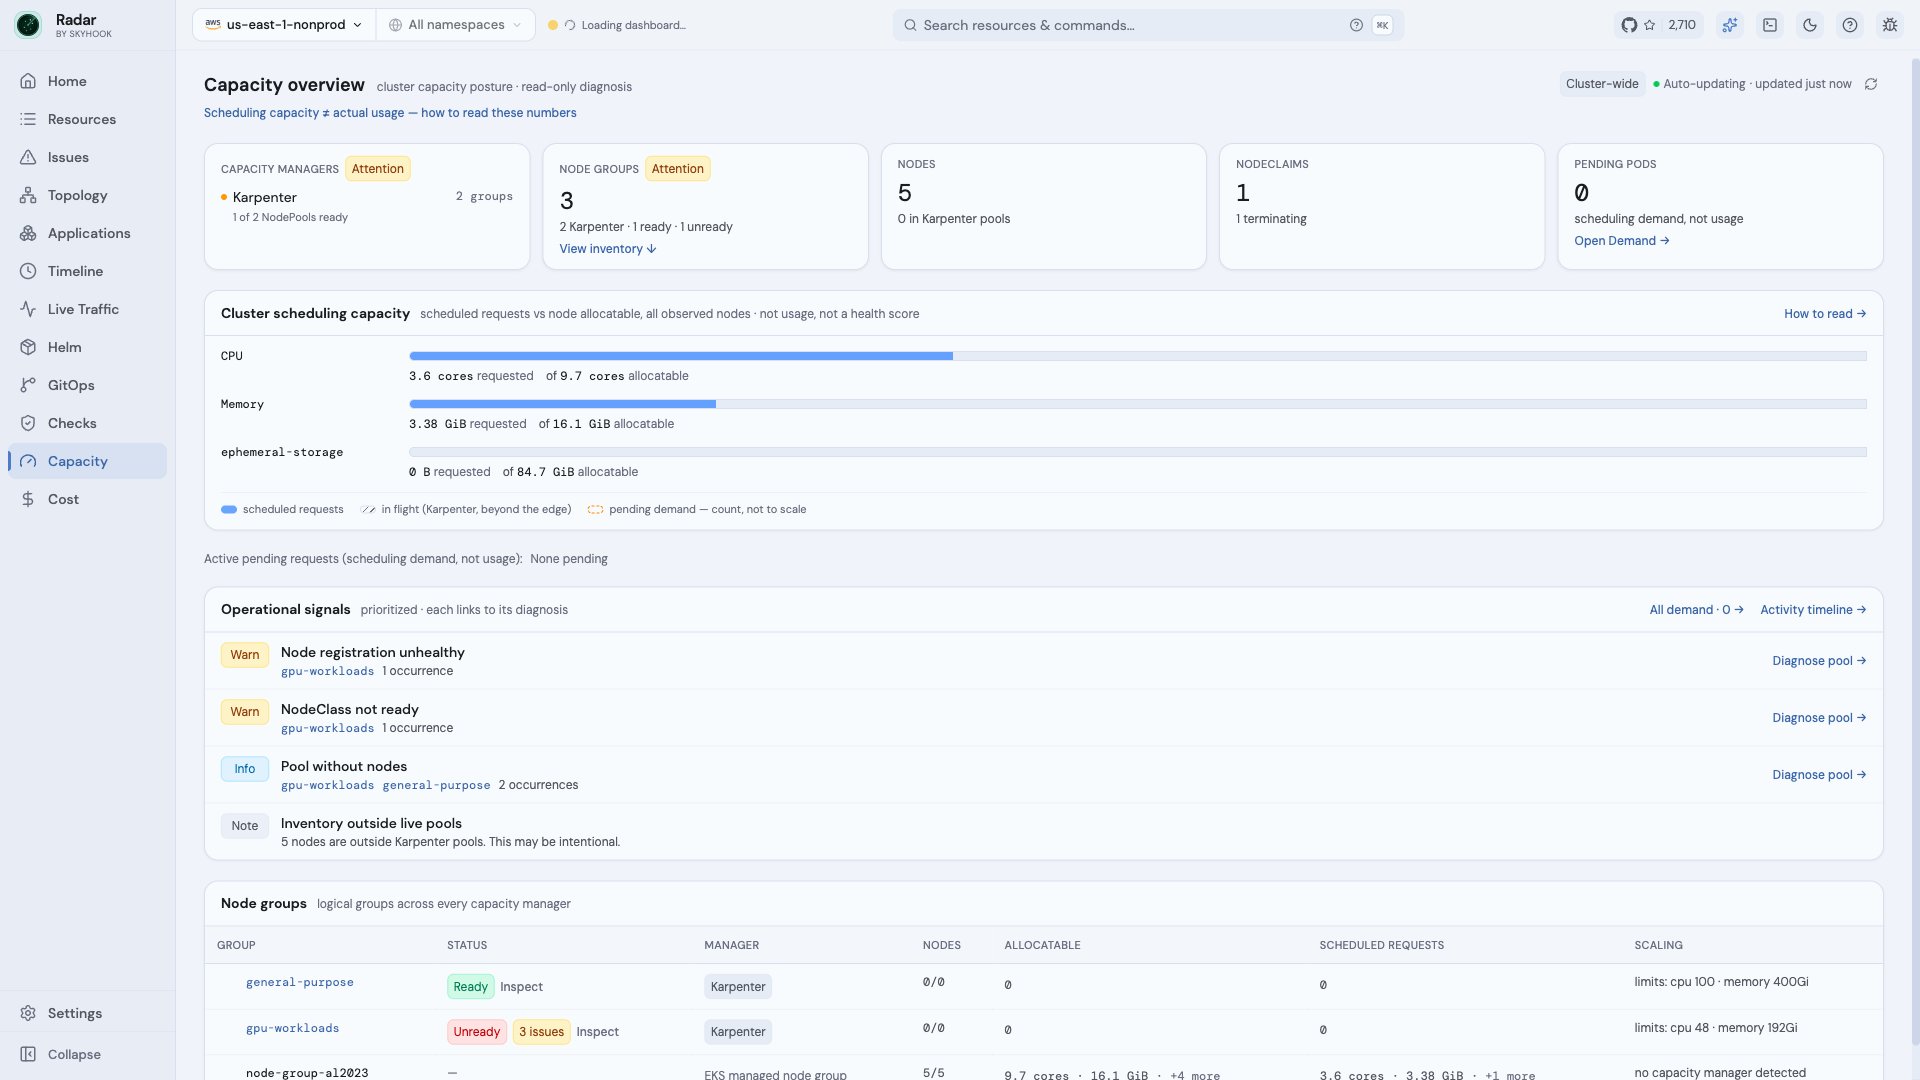
Capacity overview - managers, the scheduling bar, prioritized signals, and the cross-manager inventory
NodePool detail
The capacity ledger per resource: configured limit, provisioned (status.resources - Karpenter’s actual provisioning gate), limit headroom, node allocatable, scheduled requests, unallocated, and metrics-sampled actual usage. A scaled-to-zero pool’s ledger opens by narrating its true zeros instead of an empty table. Tabs cover claim lifecycle, fleet composition (capacity type / instance type / zone / architecture), workload attribution, and the full configuration.
A broken pool leads with its diagnosis: the Issues card - cause, next step, an Inspect link into the NodeClass, and a deep link into the pool’s provisioning episodes - renders before the ledger, with the raw controller conditions folded behind a toggle as receipts. Healthy pools keep the ledger first. Pools that declare accelerator requirements say so: a “Declared accelerator pool” fact echoes the declaration - well-known GPU requirement keys, or instance families recognized by each cloud’s naming convention - never a parsed catalogue.
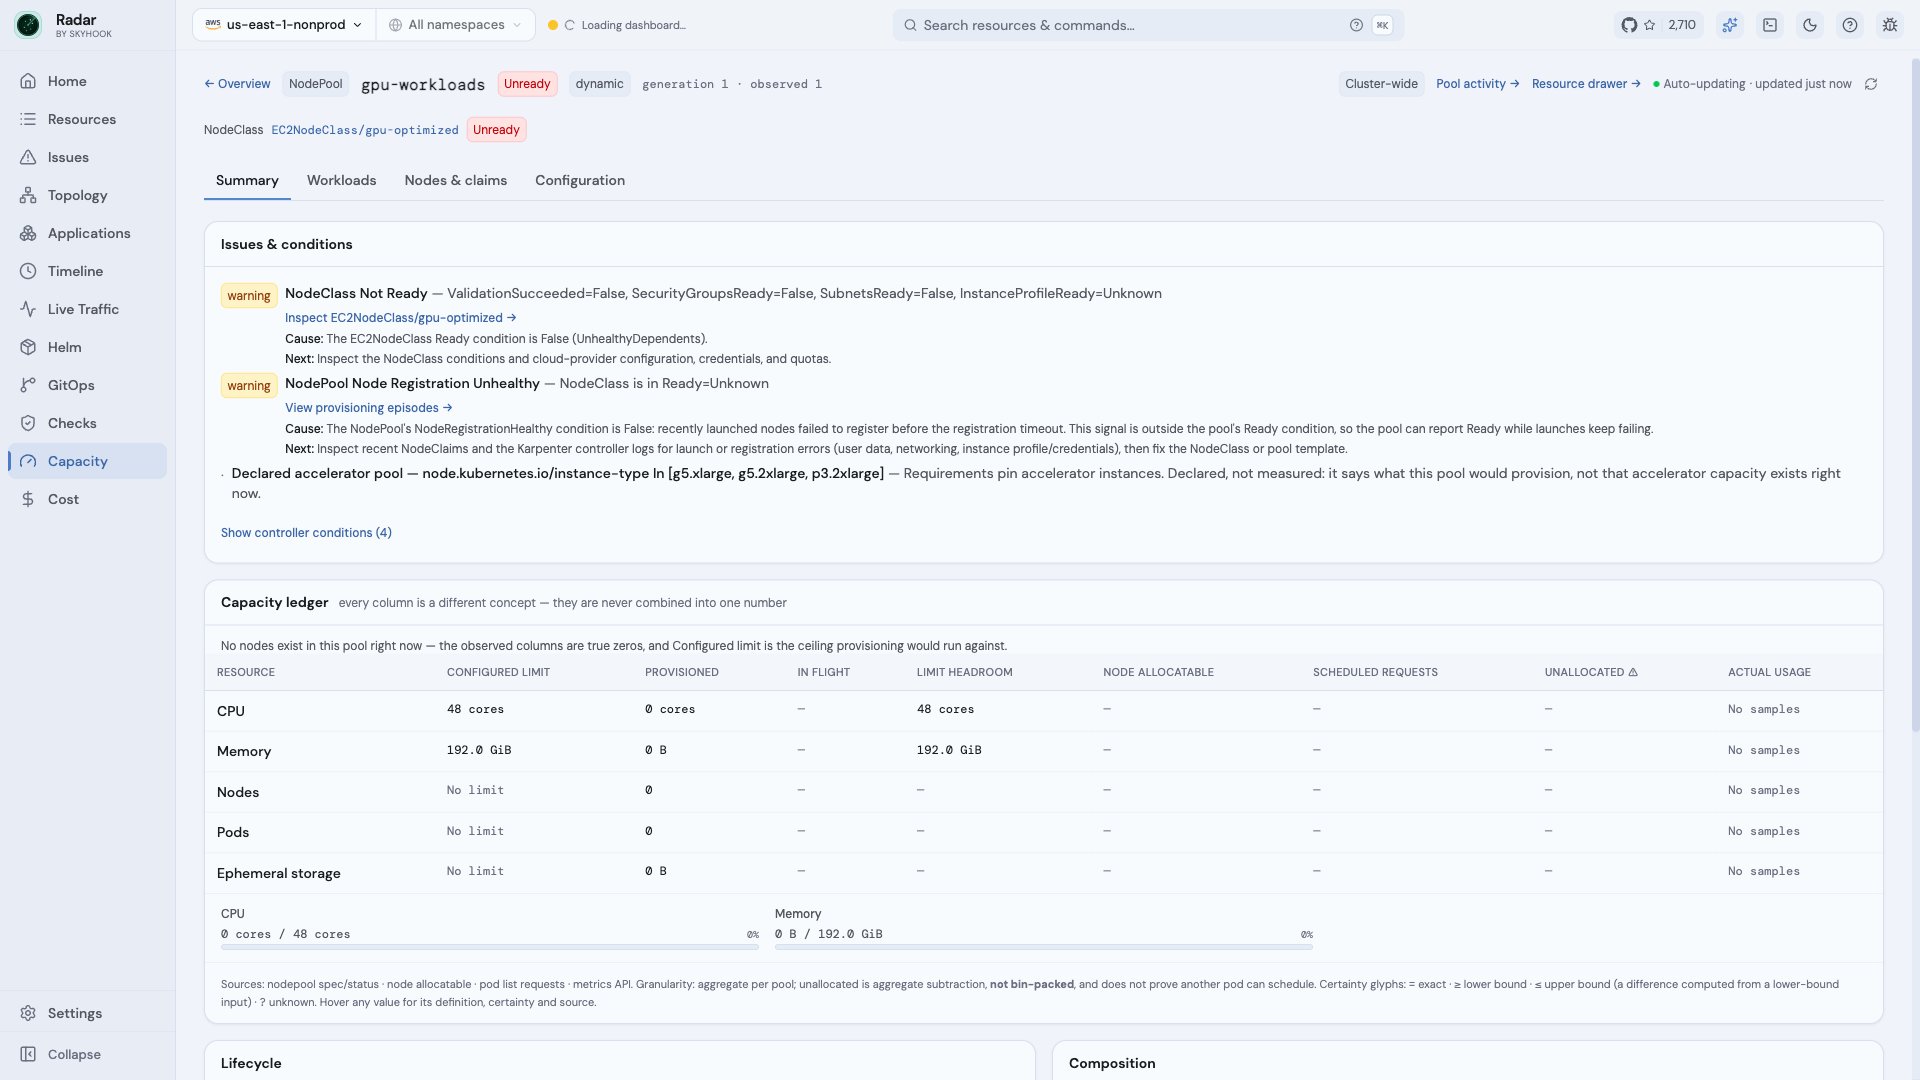
A broken NodePool leads with its diagnosis - cause, next step, and the accelerator fact - with the raw conditions folded behind a toggle
Demand
Pending pods grouped by scheduling signature - canonicalized selectors, affinity, tolerations, and requests - so five hundred pending replicas read as one group. Each group carries a conservative state (awaiting_capacity, blocked, held, waiting_for_scheduler, unknown), the scheduler’s own reasons, and pool evaluations: the group checked against every NodePool’s declared constraints with per-predicate evidence. When every evaluated pool rules a group out, the card headlines the dominant reason (“No pool can take this group - requires a label no pool declares”) with the per-predicate tables as evidence beneath. Filter by state, by pool, by workload owner, or by pod (resolved server-side to the same owner the grouping uses) - the forms the Issues and Pod-drawer bridges use, filtered server-side so an empty result is a true zero. Empty states name their truth: nothing is pending (the success state), visibility is namespace-bounded, or no groups match the named filter.
Evaluations cover Karpenter NodePools only: blocked means no NodePool can take the demand, not that no node can - on mixed clusters, capacity Karpenter does not manage may still satisfy it.
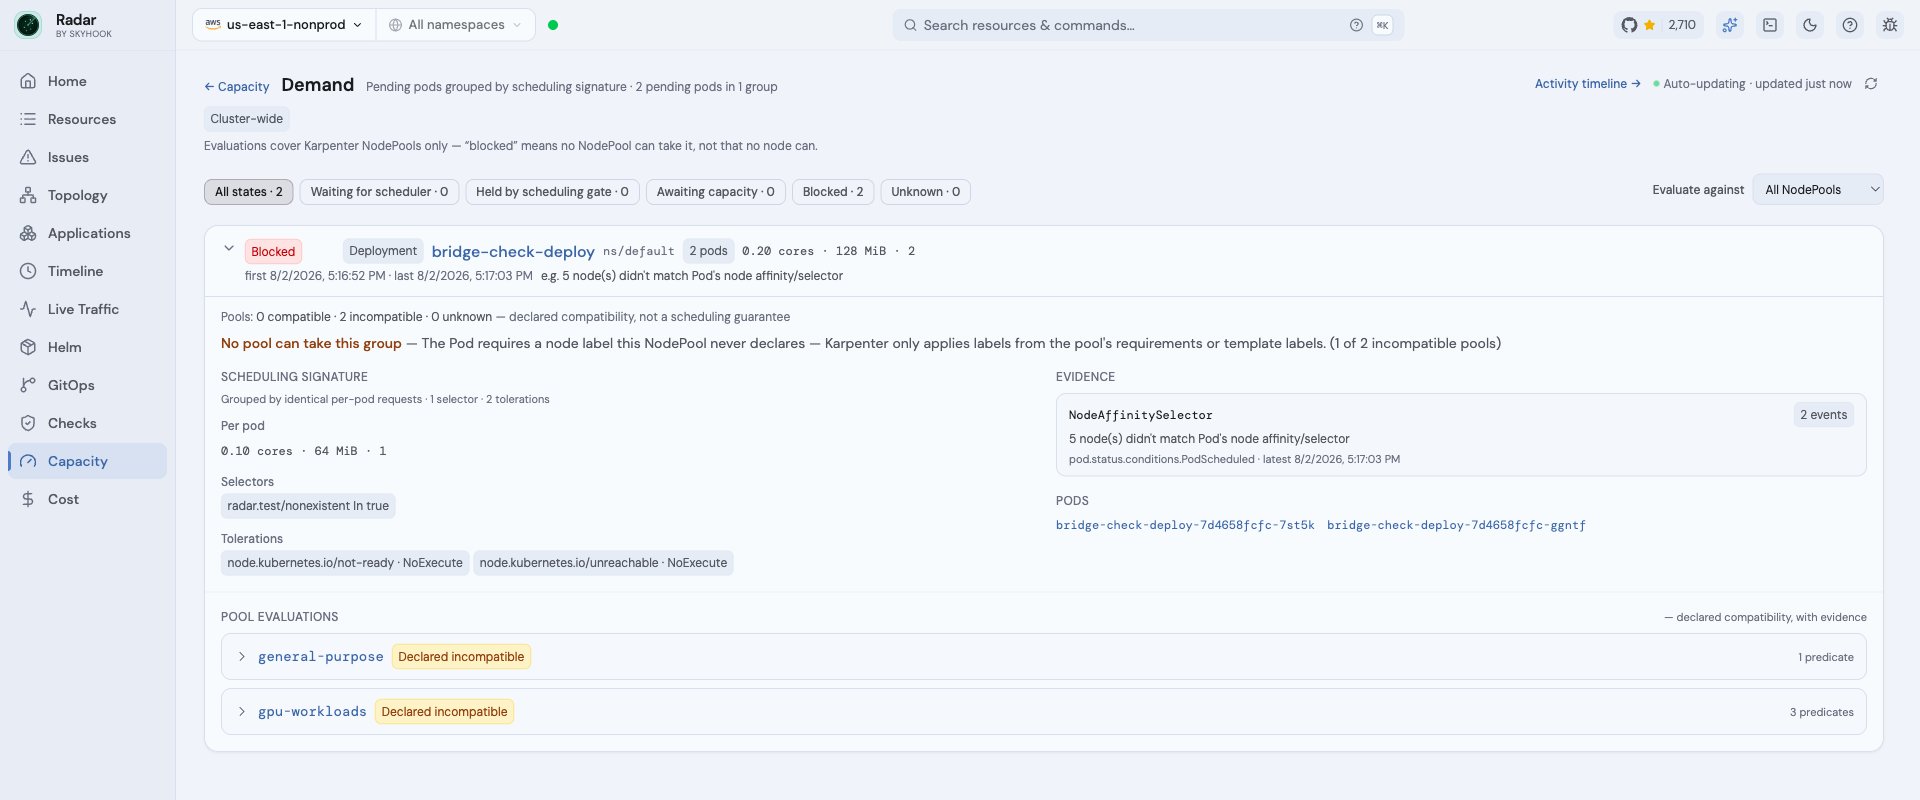
A blocked demand group headlines its dominant reason; per-pool predicate evaluations are the evidence beneath
Activity
A bounded evidence timeline of provisioning, disruption, interruption, termination, and config-change episodes, classified from Karpenter’s exact event vocabulary. A type rollup strip summarizes the whole retained window (“Provision · 28 · 3 failed”) as filter pills that stay stable while the type filter narrows the list; counts render as lower bounds whenever coverage is partial. Evidence tables lead with when/source/raw/references, with pipeline provenance behind a per-episode toggle.DisruptionBlocked and Unconsolidatable read as disruption being blocked - the opposite of disruption happening. A claim that records a failure signal closes its provisioning episode as failed the moment the signal lands; a claim deleted before ever reaching Ready with no recorded cause closes as ended - the episode never reads as still in progress, and Radar never asserts a failure it did not observe. Heuristic matches are labeled inferred, never presented as fact.
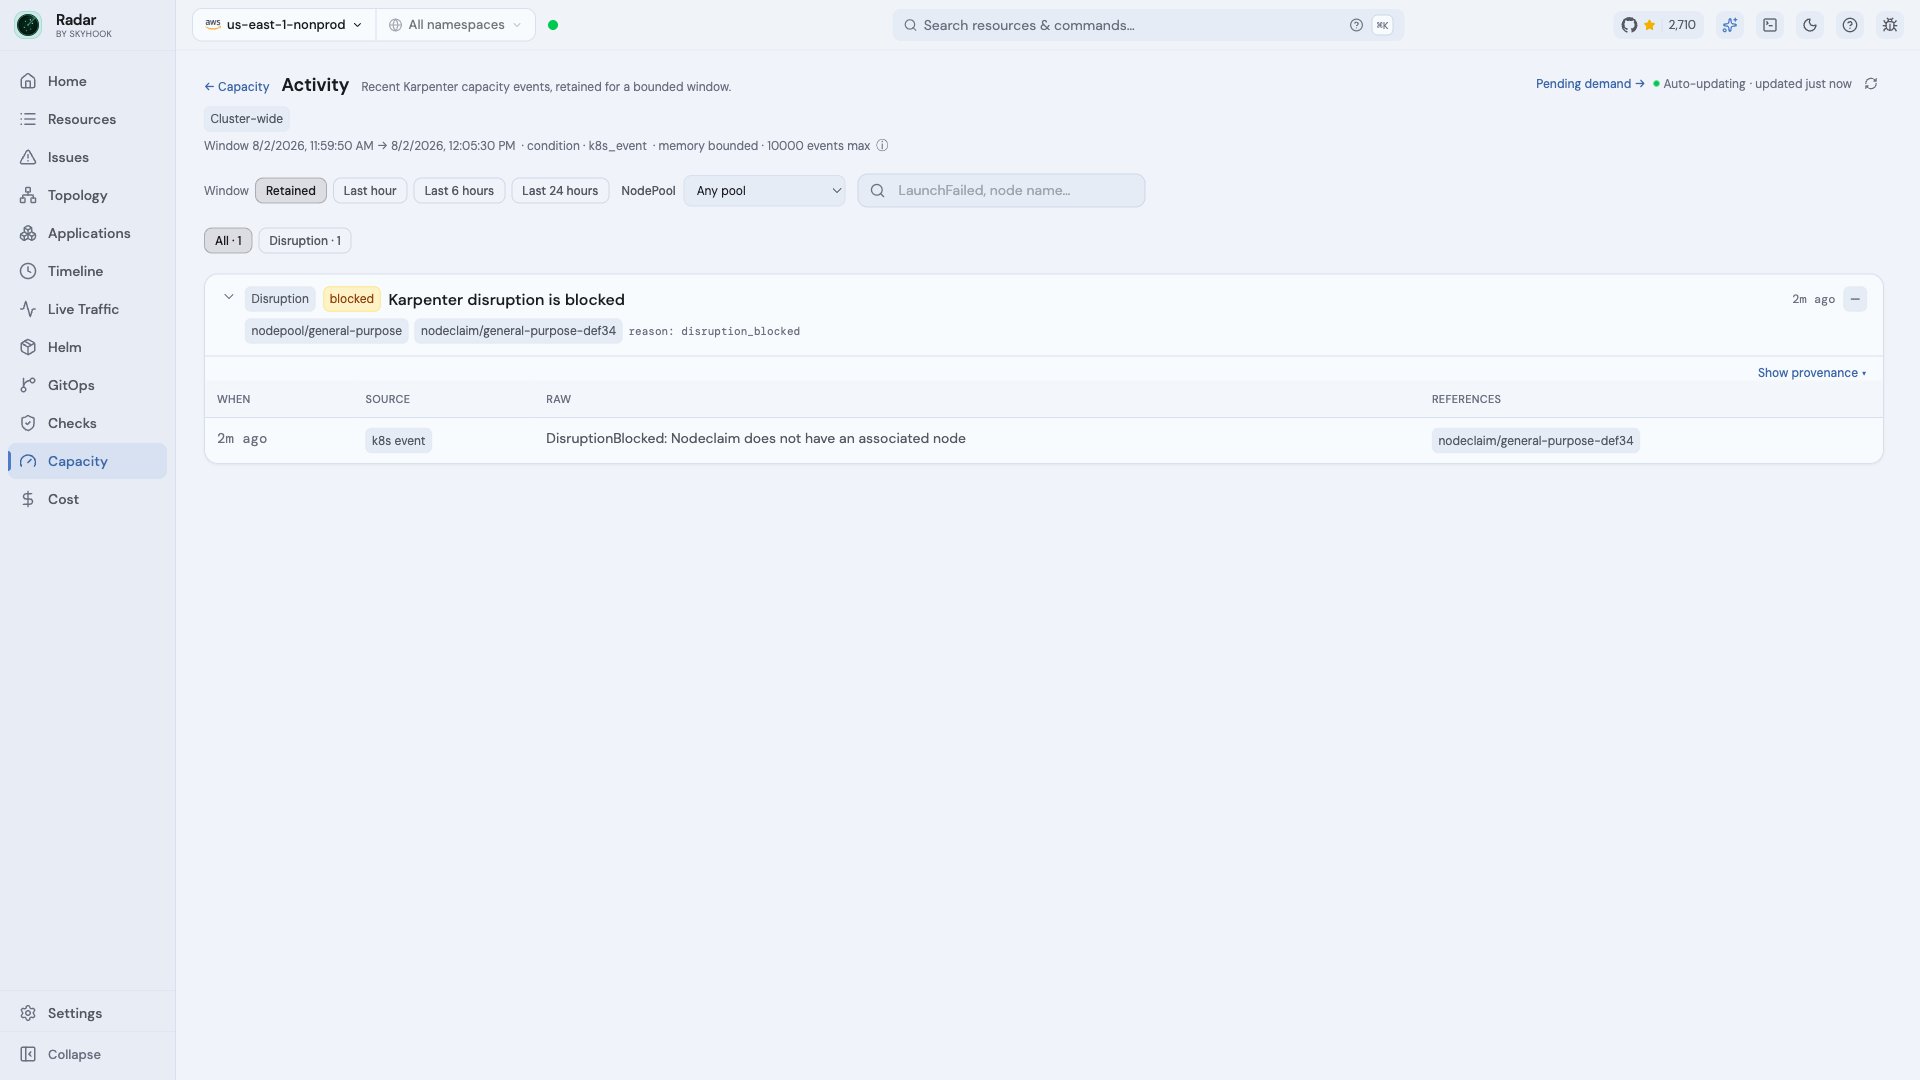
A disruption-blocked episode with its raw evidence - when, source, and references
Node groups without Karpenter
The group inventory works on every cluster, built entirely in-cluster:- Identity comes from node labels (
cloud.google.com/gke-nodepool,eks.amazonaws.com/nodegroup,kubernetes.azure.com/agentpool,karpenter.sh/nodepool) - never from parsing provider group names, which truncate. Nodes with no identity evidence are counted as unattributed, never guessed into a group. - Autoscaler bounds come from the
cluster-autoscaler-statusConfigMap that the Cluster Autoscaler - including the GKE and AKS managed autoscalers - publishes inkube-system. Radar parses both the structured format (autoscaler 1.30+) and the legacy text format, and joins per-zone groups to logical groups by node-name evidence. - The ConfigMap’s own timestamp renders as “as of T”: healthy, quiet clusters publish hours-old payloads, so age is context, not breakage.
Entry points
You rarely start at the nav:- Home shows a capacity card on every cluster with a capacity story: full Karpenter posture when available, softened rows with an honest “Karpenter view unavailable” header when NodePools are denied, manager and group counts on Karpenter-less clusters - and no card at all when there is nothing to say.
- Issues adds “View in Capacity” on capacity-relevant scheduling issues - it lands on Demand filtered to the affected workload. The flag fires for any pod evaluated against NodePools, compatible or not: a rejected pod is exactly the one the diagnosis serves.
- Pending pods in the resource drawer offer “Evaluate against Karpenter NodePools”, landing on Demand filtered to that pod’s workload. The workload page offers the same bridge whenever its pods await scheduling.
- NodePool drawer offers “Open in Capacity”.
- On clusters without Karpenter, the pending-pods tile hands off to Issues instead of dead-ending.
Reading the numbers
Every quantity carries its own certainty. Exact is the quiet default - glyphs render only on deviation, so≥ and ? stand out exactly where they matter:
The invariants behind the glyphs: unavailable is never rendered as zero (a denied or unobserved source says “Unavailable”, not
0), partial is never rendered as exact, and scheduling capacity is kept structurally apart from actual usage - Karpenter schedules on pod requests, so usage is an efficiency signal, never scheduler headroom. The bar never acquires health colors: high utilization is a bin-packing goal, not an incident.
Two measured facts about pending demand are surfaced without changing a group’s state. Requests from pods with spec.priority < 0 are reported separately as negativePriorityRequests - a measured priority fact about potential preemption victims, not an overprovisioning claim, since actual preemption depends on scheduler policy, placement, and disruption constraints. Pods holding a scheduler node nomination (status.nominatedNodeName) are annotated per demand group; nomination is best-effort and can go stale, so it never changes the group’s state or a pool’s eligibility.
What “declared compatible” means
Pool evaluations check whether the pod’s declared scheduling contract intersects the NodePool’s declared provisioning contract: readiness, permanent taints vs tolerations, selector feasibility, configured limits,minValues, and observed member shapes. The boundaries are deliberate:
- A required label the pool never declares is incompatible - Karpenter only applies labels from pool requirements and template labels. This is the classic misconfiguration.
- Provider labels (zone, instance-type, capacity-type) are unknown when undeclared, but compatible when the pool’s own
Inrequirement bounds the values and the pod’s need intersects them. - Requests that fit no observed member shape degrade to unknown - shapes are compared as whole vectors, so a pool cannot fabricate a composite machine from its biggest CPU and biggest memory on different instance types.
Scope and RBAC
Capacity is deliberately cluster-wide: supply (NodePools, Nodes, NodeClaims) is cluster-scoped, so the namespace view filter does not apply - scoping only the pod-derived numbers would show “my namespace’s demand” against “everyone’s supply”. RBAC and the--namespaces deployment flag remain the only scopers, and coverage badges label both.
Limitations
- No scheduling simulation. Declared contracts only - no provider offering catalogues, spot availability, or bin-packing.
- DRA demand is invisible to the requests ledger. Classic Dynamic Resource Allocation
ResourceClaims(GA since Kubernetes 1.34) express accelerator demand outside container requests, so DRA-based accelerator demand never appears in the requests ledger - demand evaluation already degrades such pods to a labeledunknownrather than guessing. - No trends yet. Current state plus the bounded activity window.
- Single cluster. Like the rest of Radar OSS, Capacity describes the connected cluster.
See also
- Karpenter integration - topology chain and CRD detail views.
- Issues - where capacity-relevant scheduling problems surface first.
- Cost insights - the spend side of the same fleet.