Everything Is Green and Nothing Works: Network Reachability in Radar
Pods Ready, Service green, curl times out. Radar's Reachability tab traces the declared network path and live-probes it, naming the first hop that breaks.
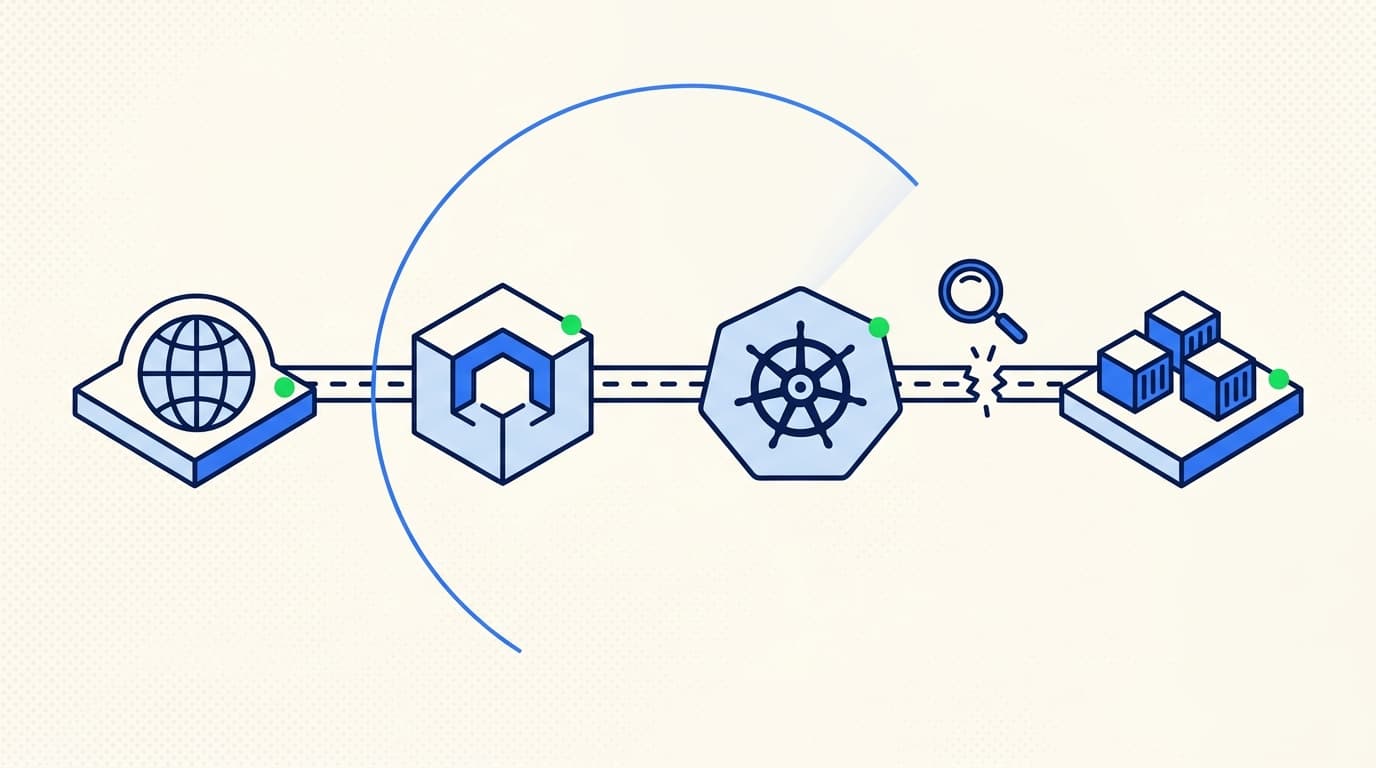
A checkout Deployment listening on port 80, behind a Service that dials 8080:
# Deployment: the port the container actually opens
ports:
  - containerPort: 80    # nginx listens here
---
# Service: the port it forwards to
ports:
  - name: http
    port: 80
    targetPort: 8080     # ...but the Service dials here
Nothing here is red. Pods are 2/2 Ready - no readiness probe consults a Service's targetPort, why would it. The Service is Active with endpoints listed. The Ingress has an address. No Warning events, because no controller considers anything wrong. kubectl get returns clean output on every object on the path, which is exactly why this class of bug survives the first twenty minutes of debugging.
Open the Service's Reachability tab:
Radar v1.9.1 adds that tab to Services, Ingresses, Gateways, and HTTPRoute/GRPCRoute. It traces the declared network path hop by hop, live-probes it, and names the first hop that breaks - here, "Service targetPort likely wrong", from config analysis alone, before a packet moved. It's in the open-source version.
Read the headline again, though: "Unreachable via API server - real path not confirmed." Not "your service is down." That hedge is the most important design decision in the feature.
Two layers, one question
The tab answers exactly one question about a network entry point:
If traffic is sent toward this resource, does it reach a healthy process - and if not, which hop is the first to break?
Two layers answer it:
- A static trace, always on. Ingress to Service to selected pods, route to parent Gateway, selectors, ports, readiness. Pure functions over Radar's in-memory informer cache - no API calls, typically under 100ms.
- An active test: one round of real probes along the declared path - DNS, TCP, TLS where it applies, then HTTP for HTTP-shaped ports. The round is budgeted at 3 seconds, probes run in parallel, and each layer has a strict timeout (DNS 250ms, TCP 700ms, TLS 1s, HTTP 1s) so one dead hop can't starve the rest.
The path model matches how traffic behaves. Upstreams into a resource are parallel - a Service reached by two Ingresses isn't broken because one of them is, since the other still delivers traffic. Downstream is a chain, and the first critical finding along it is the broken hop; later findings still show, but the diagnosis starts where the failure starts.
Each hop carries the findings observable at that hop, and every finding comes with the kubectl that reproduces the raw state behind it:
kubectl describe service checkout -n shop
kubectl get pods -n shop -l app=checkout
You aren't being asked to trust a verdict. You're handed the evidence trail you'd have assembled by hand, already assembled.
Where you test from changes the answer
A reachability result is meaningless without knowing where the request came from. It works from your laptop but not from the caller pod, or the reverse, and the difference is the bug.
So the vantage is first-class, drawn as its own lane on the graph. There are three:
- Radar on your machine - dialing as an ordinary client on your network
- API-server proxy - relayed through Kubernetes (
/services/{name}:{port}/proxy/), which bypasses parts of the real traffic path - In-cluster probe - a consent-gated, throwaway pod testing from the real dataplane, where NetworkPolicy and mesh mTLS actually apply
Selecting a vantage genuinely re-routes the graph and re-scopes the verdict; a laptop's success is never painted onto the in-cluster lane. And the vantages Radar cannot use - a request from one of your actual caller workloads, a genuine external client - stay visible as stated gaps rather than quietly disappearing, so a synthetic test never masquerades as full coverage.
Here's what that buys you. In the same namespace as the broken checkout Service, payments sits behind a NetworkPolicy named payments-allow-checkout-only:
The API-server proxy got an HTTP 200. Paint that green and you'd ship, and real callers would still fail, because the proxy's path is not your callers' path. So the headline reads "Reached via API server - not live traffic (HTTP 200)", the inspector spells out what the 200 proves ("something is serving") and what it doesn't ("that the normal path works"), and the NetworkPolicy sits on the pods hop as a source-restricted advisory. Whether a caller gets through depends on who the caller is, which no synthetic probe can settle.
The three classic ways a probe lies to you are all vantage problems:
- Service mesh mTLS. Strict mTLS rejects any connection without a mesh client certificate. Your laptop doesn't have one. The probe fails while sidecar-to-sidecar traffic is perfectly healthy.
- NetworkPolicy. Policies are source-scoped. A policy can allow real workload traffic while blocking the probe's identity, or the reverse.
- Split-horizon DNS. A hostname that resolves inside the cluster may not resolve from your machine, or may resolve to something else entirely.
The rule for all three: a failure attributable to the vantage itself never sets the headline verdict. It annotates the hop, localizes the symptom, and leaves the verdict at unknown instead of condemning a path real traffic may well reach. We call it failing toward silence - better "couldn't confirm from here" than a 2am false alarm about a service that's fine.
The rules that keep it honest
The same principle, in four more places.
Verdicts are coverage claims, not vibes. Each tested route carries an outcome (verified, reached, server-error, unreachable, not-tested) and a confidence (real traffic vs. indirect relay). Those roll up into the resource verdict, and only a real-traffic result can set it. Reached only via the API-server proxy rolls up to unknown, never to a confident green.
Non-HTTP ports get non-HTTP tests. A Redis or Postgres Service gets an honest TCP connection test, not a fabricated HTTP request thrown at a database port, and the result states its own ceiling:
"Reachable - server reached, route not verified", footed by TCP connections only - application protocol not checked. The transport works. Nothing beyond that is claimed.
NetworkPolicy is predicted, never enforced by Radar. The static layer evaluates the caller-independent ingress rules of policies selecting the subject's pods and surfaces a would-block as a prediction, because the CNI is the only authority on enforcement and some CNIs store the NetworkPolicy object while enforcing none of it. The in-cluster probe then confirms the prediction or downgrades it when real traffic got through.
Skipped checks say why. A route that couldn't be tested from a given vantage shows as skipped with the reason, per vantage, instead of quietly vanishing from the report.
And the lines it won't cross:
- No external-path probing for LoadBalancer / NodePort. Modeling cloud load balancer state honestly is its own problem; pretending to have solved it would produce exactly the false confidence this feature exists to kill.
- No CNI-specific enforcement modeling. Prediction plus live confirmation, as above.
- No Traefik IngressRoute, Istio VirtualService, or Knative resolution yet. Each needs its own path logic, and guessing produces wrong graphs.
- No new CRDs, no agents to install. Everything reads the same informer cache as the rest of Radar, and active probes are one-shot actions you trigger, not a polling loop.
Nor does a probe pod land in your cluster unless you click the button. The in-cluster test is consent-gated, and the dialog names the exact requests before it runs - one short-lived, self-deleting Job per request, under the target namespace's ServiceAccount. If your RBAC denies pod creation, Radar falls back to a copyable kubectl command instead of failing mysteriously. (Why "read-only plus explicit, visible actions" is the right shape for cluster tooling is a post of its own.)
How this compares
| Approach | What it gives you | The catch |
|---|---|---|
| kubectl checklist + netshoot | Ground truth, eventually | You're the correlation engine; 8-10 commands and a mental model of the path |
| Hubble (Cilium) | Per-flow verdicts with drop reasons, from eBPF | Requires Cilium as your CNI; observes traffic that happened rather than testing a declared path on demand |
| Calico policy tooling | Policy impact analysis and packet capture | Calico-specific, policy-scoped |
| Kubeshark / tcpdump | Full packet-level truth | Heavy to run; you still reconstruct the path and the intent yourself |
| Radar Reachability | Declared path traced and live-probed from explicit vantages, first broken hop named | Won't model cloud LB paths or CNI enforcement - and tells you so instead of guessing |
Hubble is the one that composes rather than competes: Radar names which hop of the declared path breaks and from where, Hubble tells you what the datapath did to individual packets. Flow observability needs traffic to observe; a reachability test manufactures its own evidence on demand, against the path the config declares - including the hops where no traffic is flowing precisely because they're broken.
The other difference is scope. Everything above except the manual checklist ties you to a specific CNI or a capture stack. The Reachability tab is CNI-agnostic because it stays out of the enforcement-modeling business.
Agents get the same trace
Everything the tab shows is what Radar's MCP server returns. Point the general-purpose diagnose tool at a network entry kind and it returns the reachability trace in one call; probe: true adds the active test, inCluster: true runs it from the real dataplane under the caller's RBAC.
The verdict semantics matter more for agents than for humans, because agents key actions on results. The per-route outcome and confidence fields exist so an agent can tell "verified over real traffic" from "reached via proxy, real path untested" instead of pattern-matching a coarse healthy/broken flag. We wrote about the general pattern in MCP for Kubernetes.
Try it
Reachability shipped in Radar v1.9.1, in the open-source version, not behind a paid gate. If you already run Radar, open any Service and hit the Reachability tab - the API-server proxy test runs automatically. If you don't:
brew install skyhook-io/tap/radar
radar
Point it at a kubeconfig, open a Service that's been quietly bothering you, and see which hop answers. The changelog entry has the release details, and the design doc covers verdict semantics, RBAC requirements, and probe image resolution in full.
kubectl can tell you everything about any one object on the path. What it can't tell you is how the path composes - and the network path is the composition question you get paged about.
Get the next issue in your inbox
Kubernetes deep-dives, new Radar releases, and what we learned shipping them.
One or two emails a month. No sales sequences. Unsubscribe anytime.
Keep reading
Karpenter Troubleshooting: Pending Pods, Failed Launches, and Nodes That Never Join
A field guide to Karpenter failures: pending pods, LaunchFailed, VCPULimitExceeded, NodeRegistrationHealthy, and DisruptionBlocked - what each one means and where the evidence lives.
Kubernetes Events Expire in an Hour. Your Incidents Don't.
Kubernetes events expire after one hour by default, and many of the changes that cause incidents never become events at all. How to keep history that survives.
Five Questions You Can't Answer With kubectl
kubectl hands you one object at a time, as raw YAML. Here are five questions - relationships, isolation, image contents, history, posture - where that runs out of road.