See what's broken, why, and what changed.
Radar turns live cluster state into answers: failures folded to their root cause, workloads grouped into the applications they form, every event kept past Kubernetes' default 1-hour TTL. All of it - plus topology, Helm, GitOps, audits, and MCP for AI agents - in one open-source binary that runs on your laptop or in your cluster.
What you open Radar to look at.
These are the views in Radar's nav rail - each ships in the open-source binary. Pick the one that hurts today and read the deep dive.
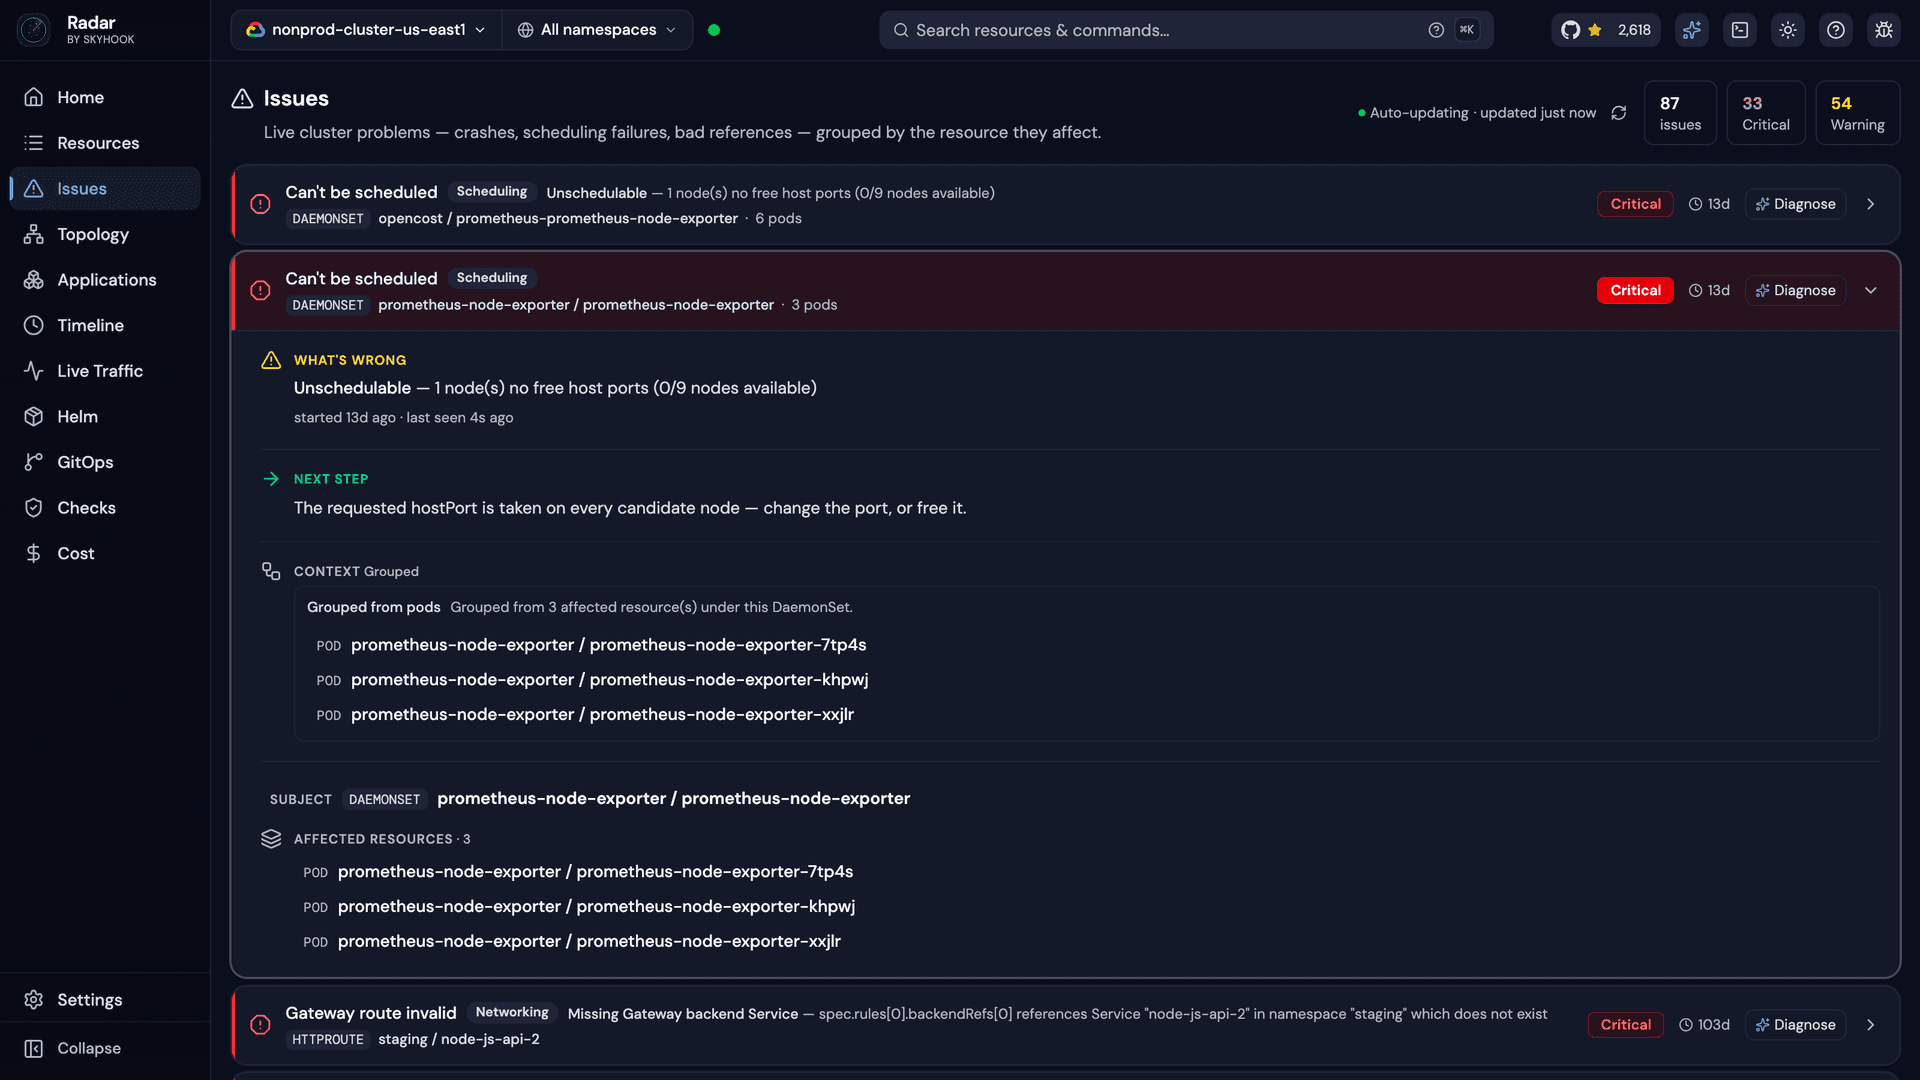
Issues & root cause
Failures classified by subject, folded into the root-cause row, with causal links and blast radius. Deterministic, with a probable cause and the change that preceded it.
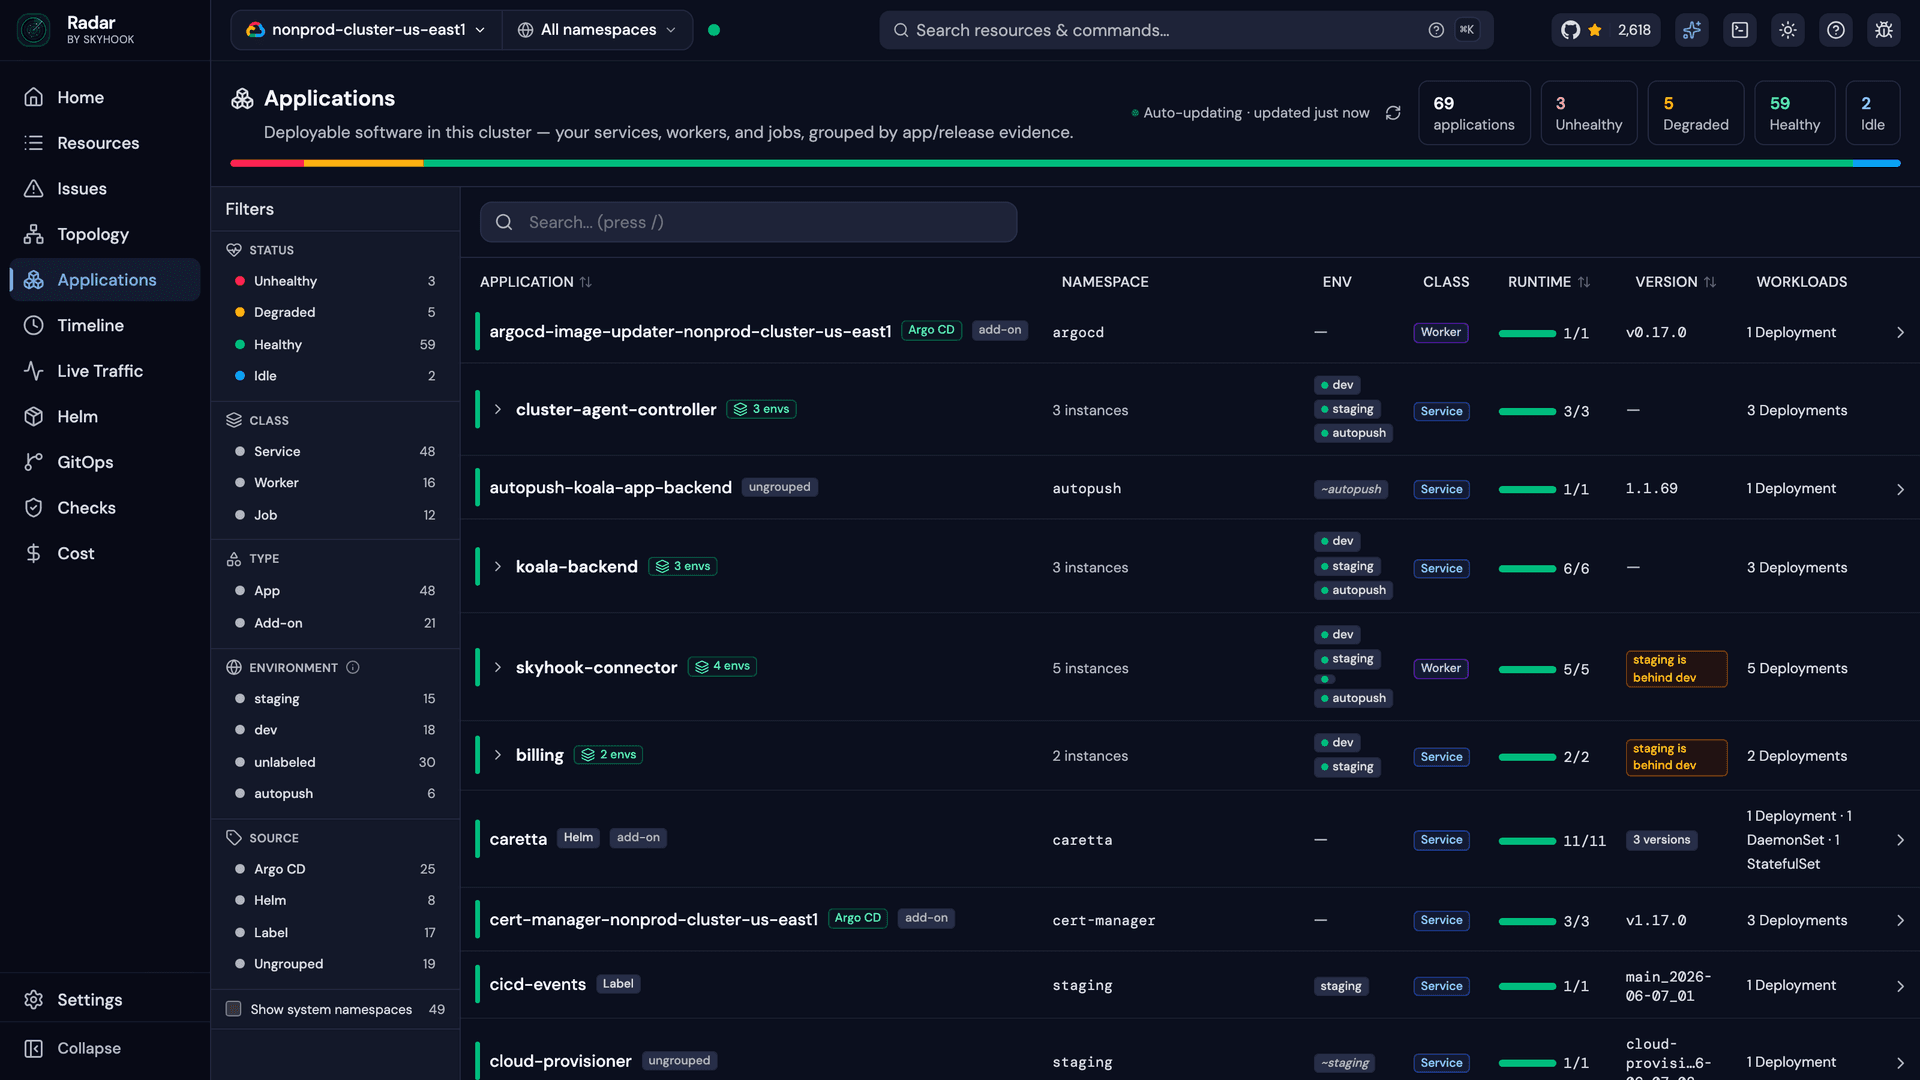
Applications view
Workloads grouped into the apps they form - Helm, Argo, Flux, label and naming evidence - with health rollups, environment folding, and version-skew badges.
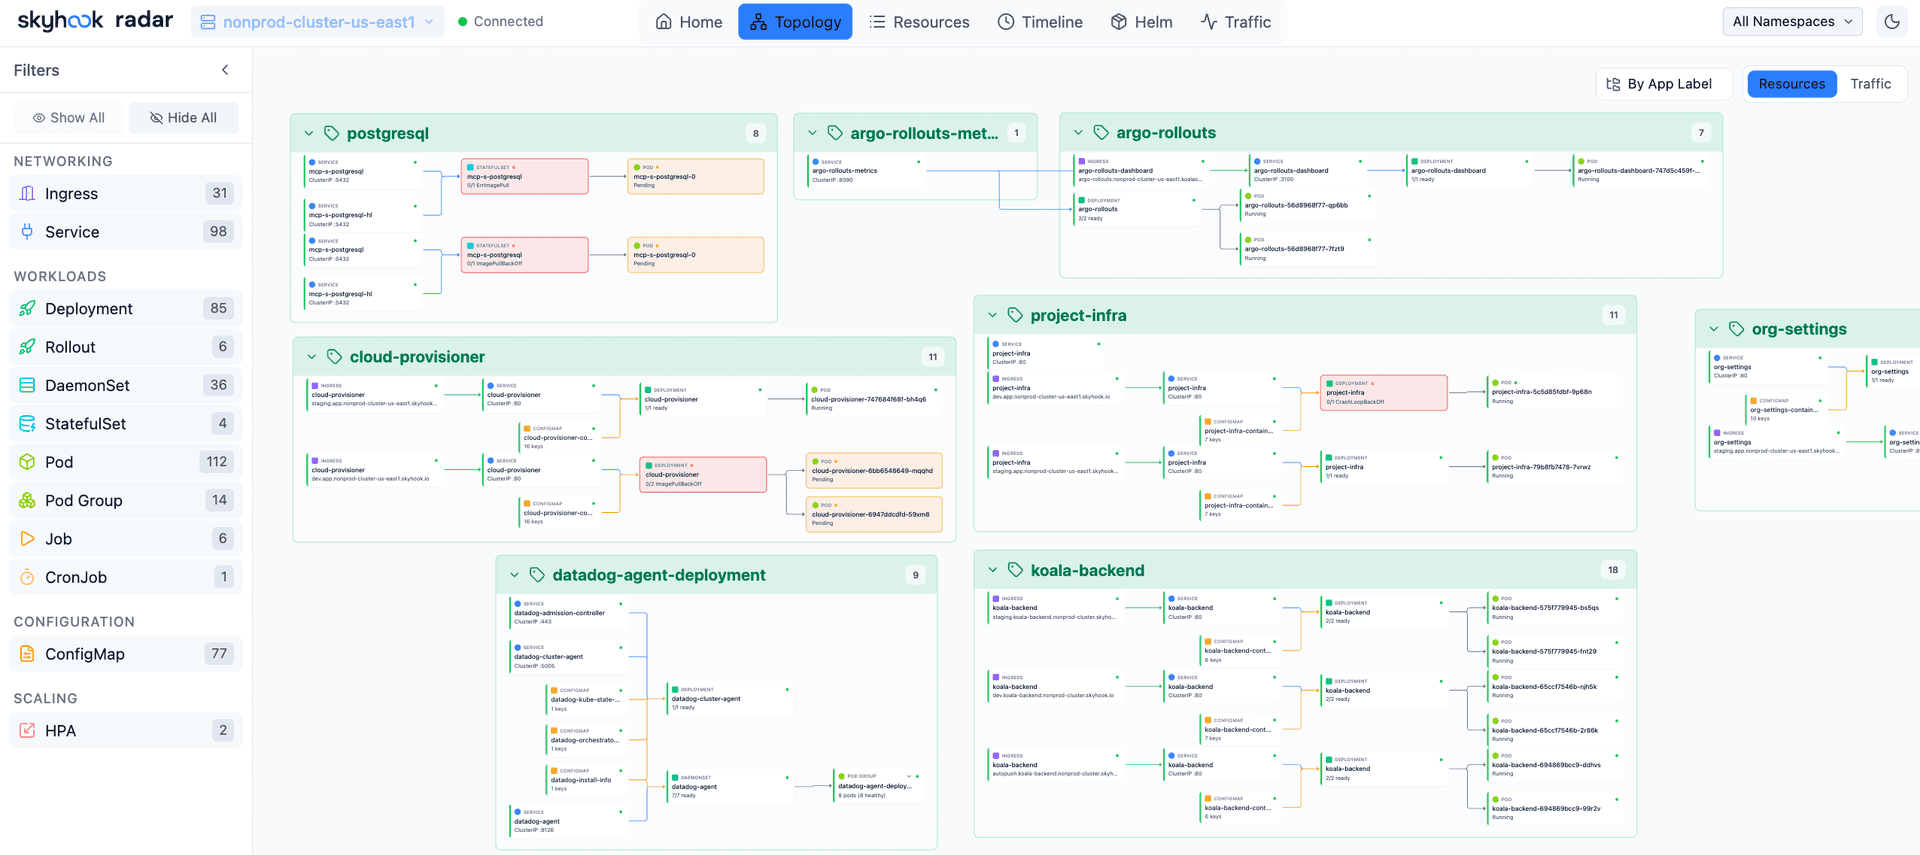
Live topology graph
Every resource and connection, laid out by ELK.js and pushed via SSE. Groups by namespace or label.
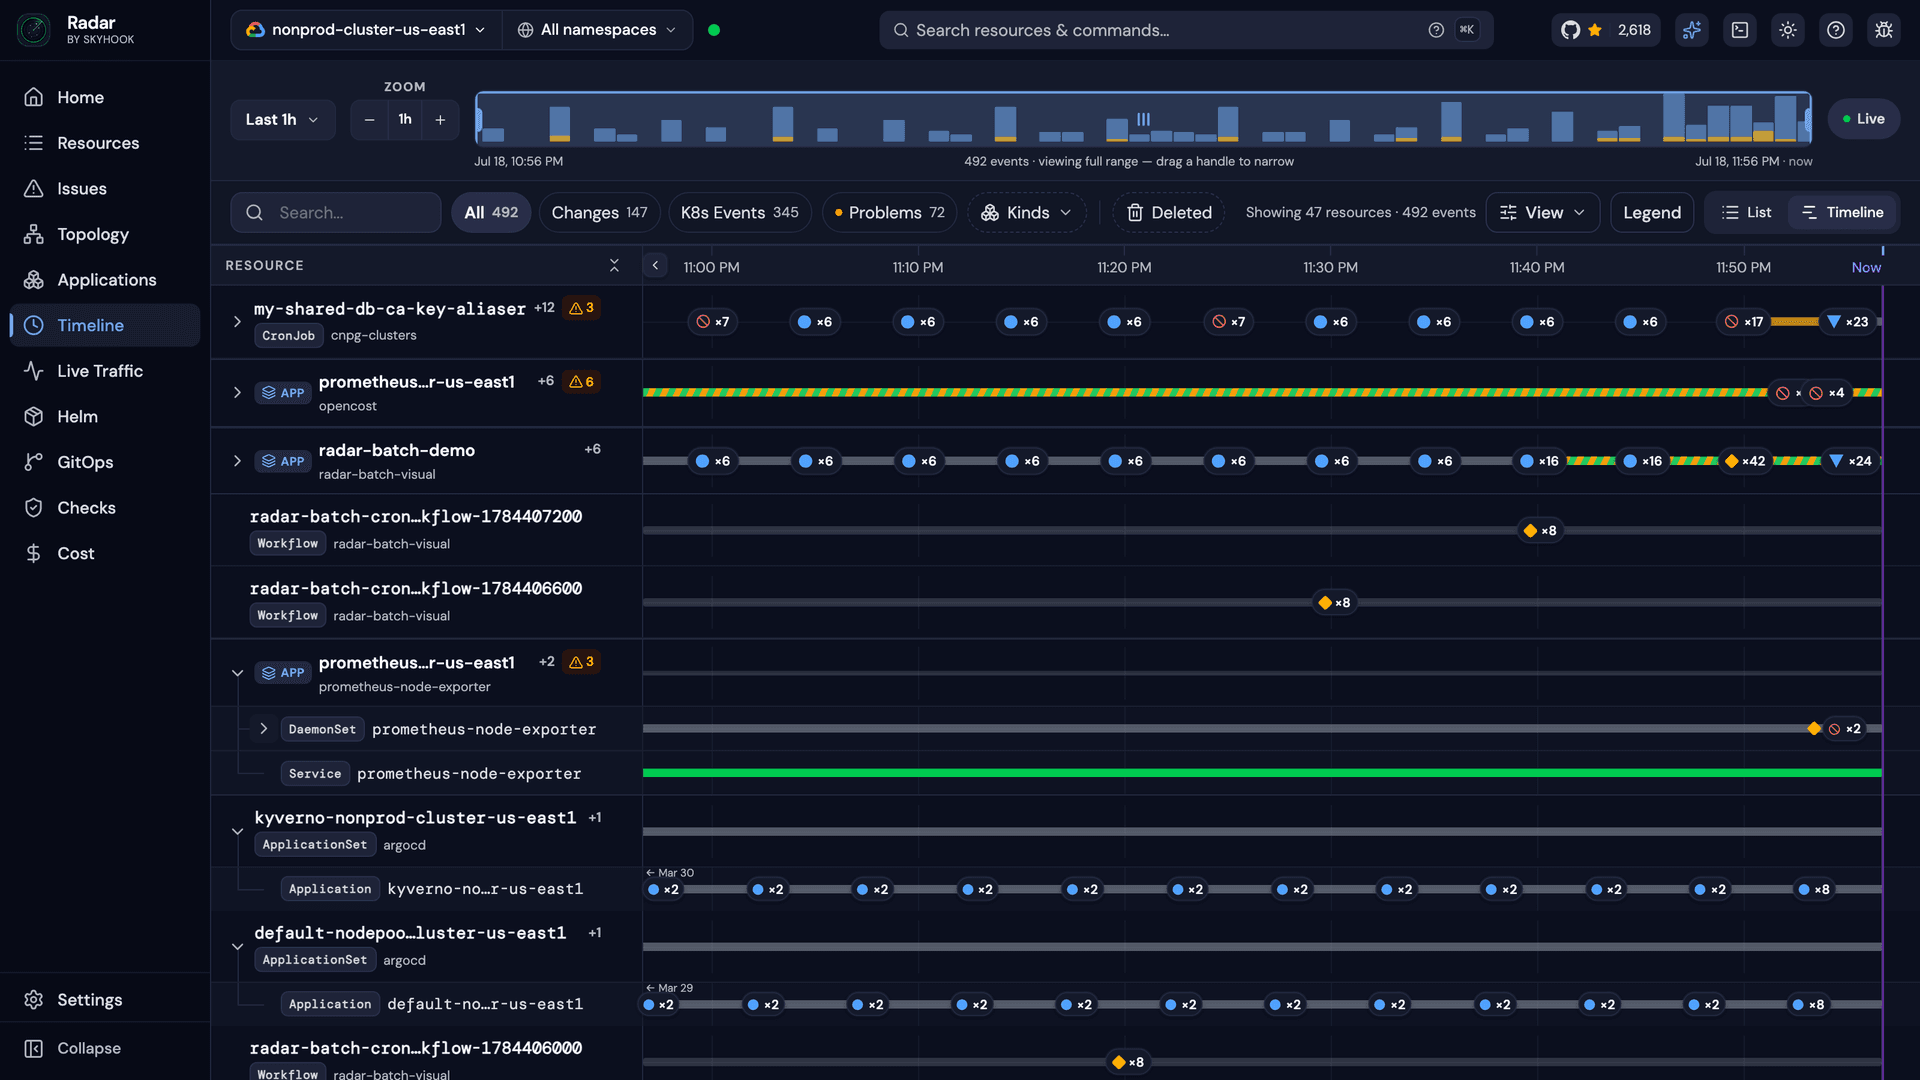
Event timeline
Every K8s event and resource delta captured the instant it fires - held past the API server's default 1-hour TTL.
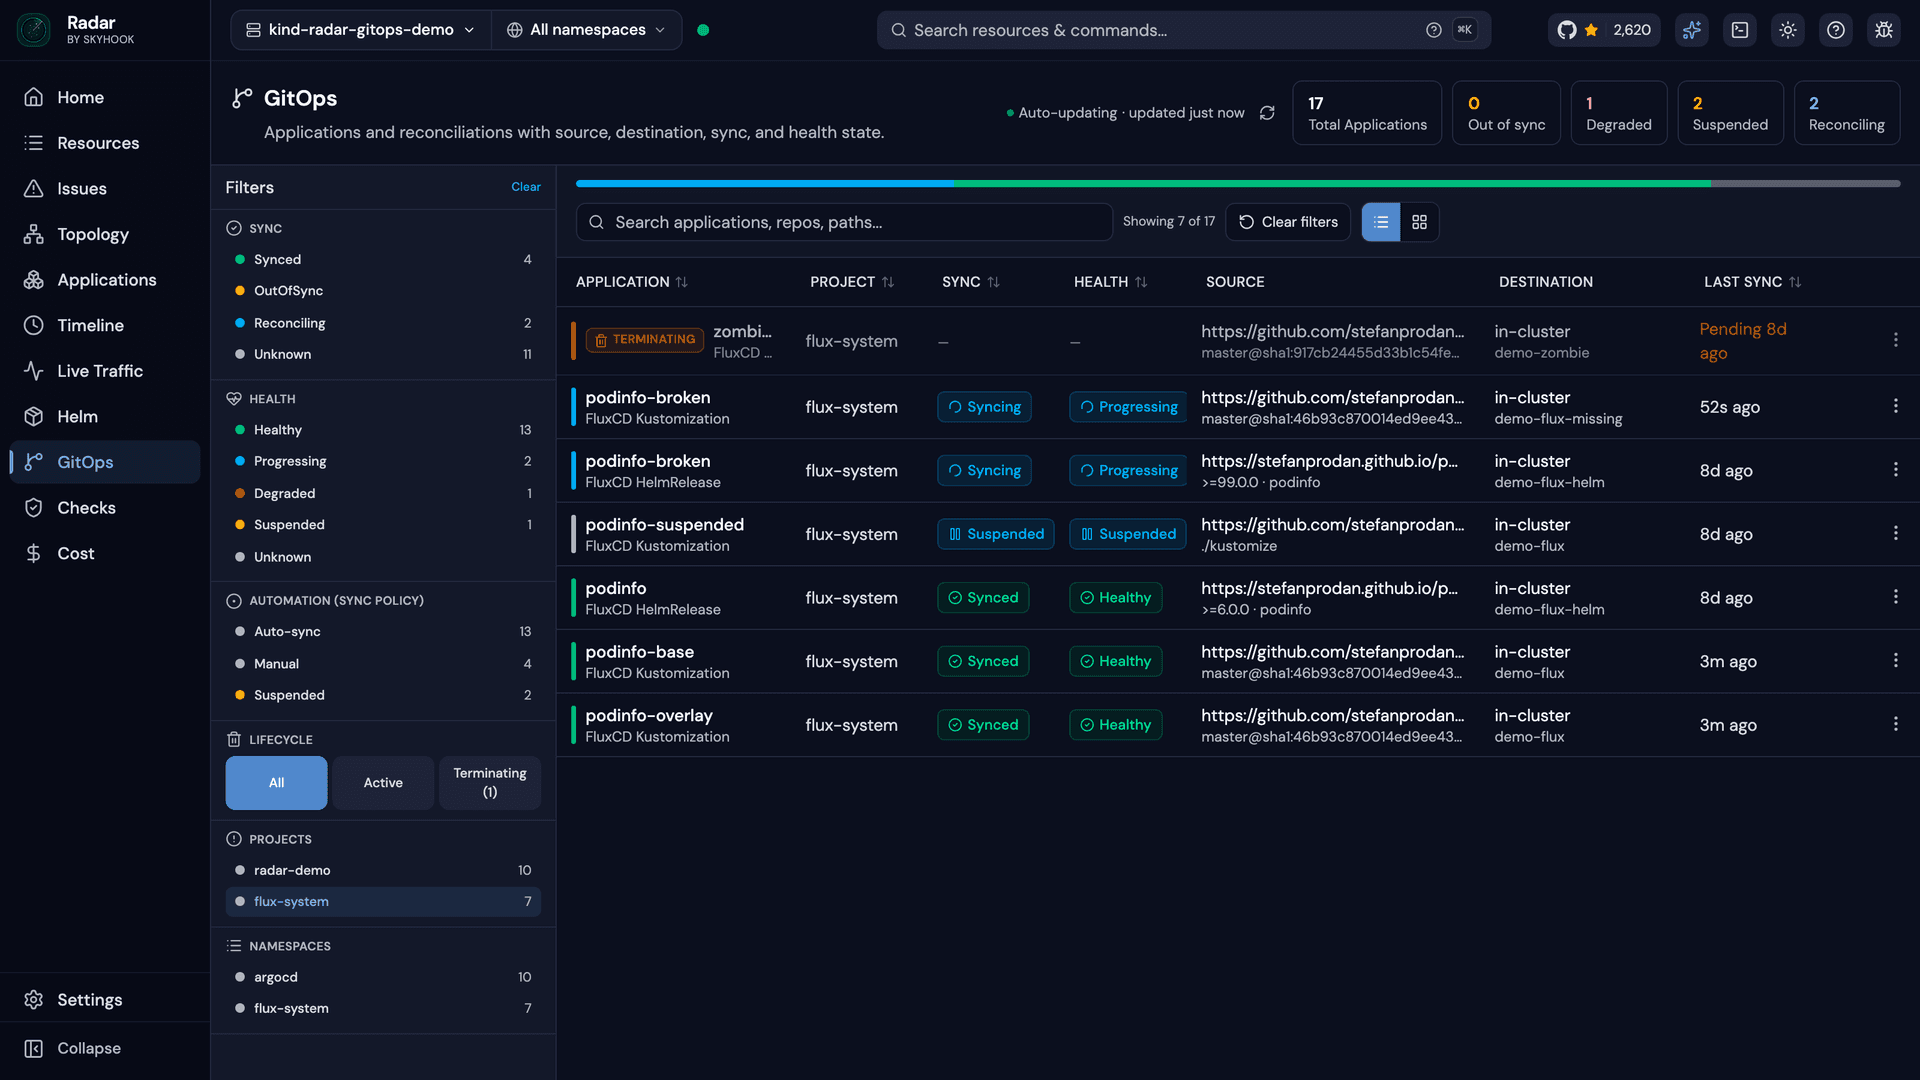
GitOps
ArgoCD and Flux in one view - sync state, field-level drift, and diagnosis of why an app is OutOfSync or stuck.
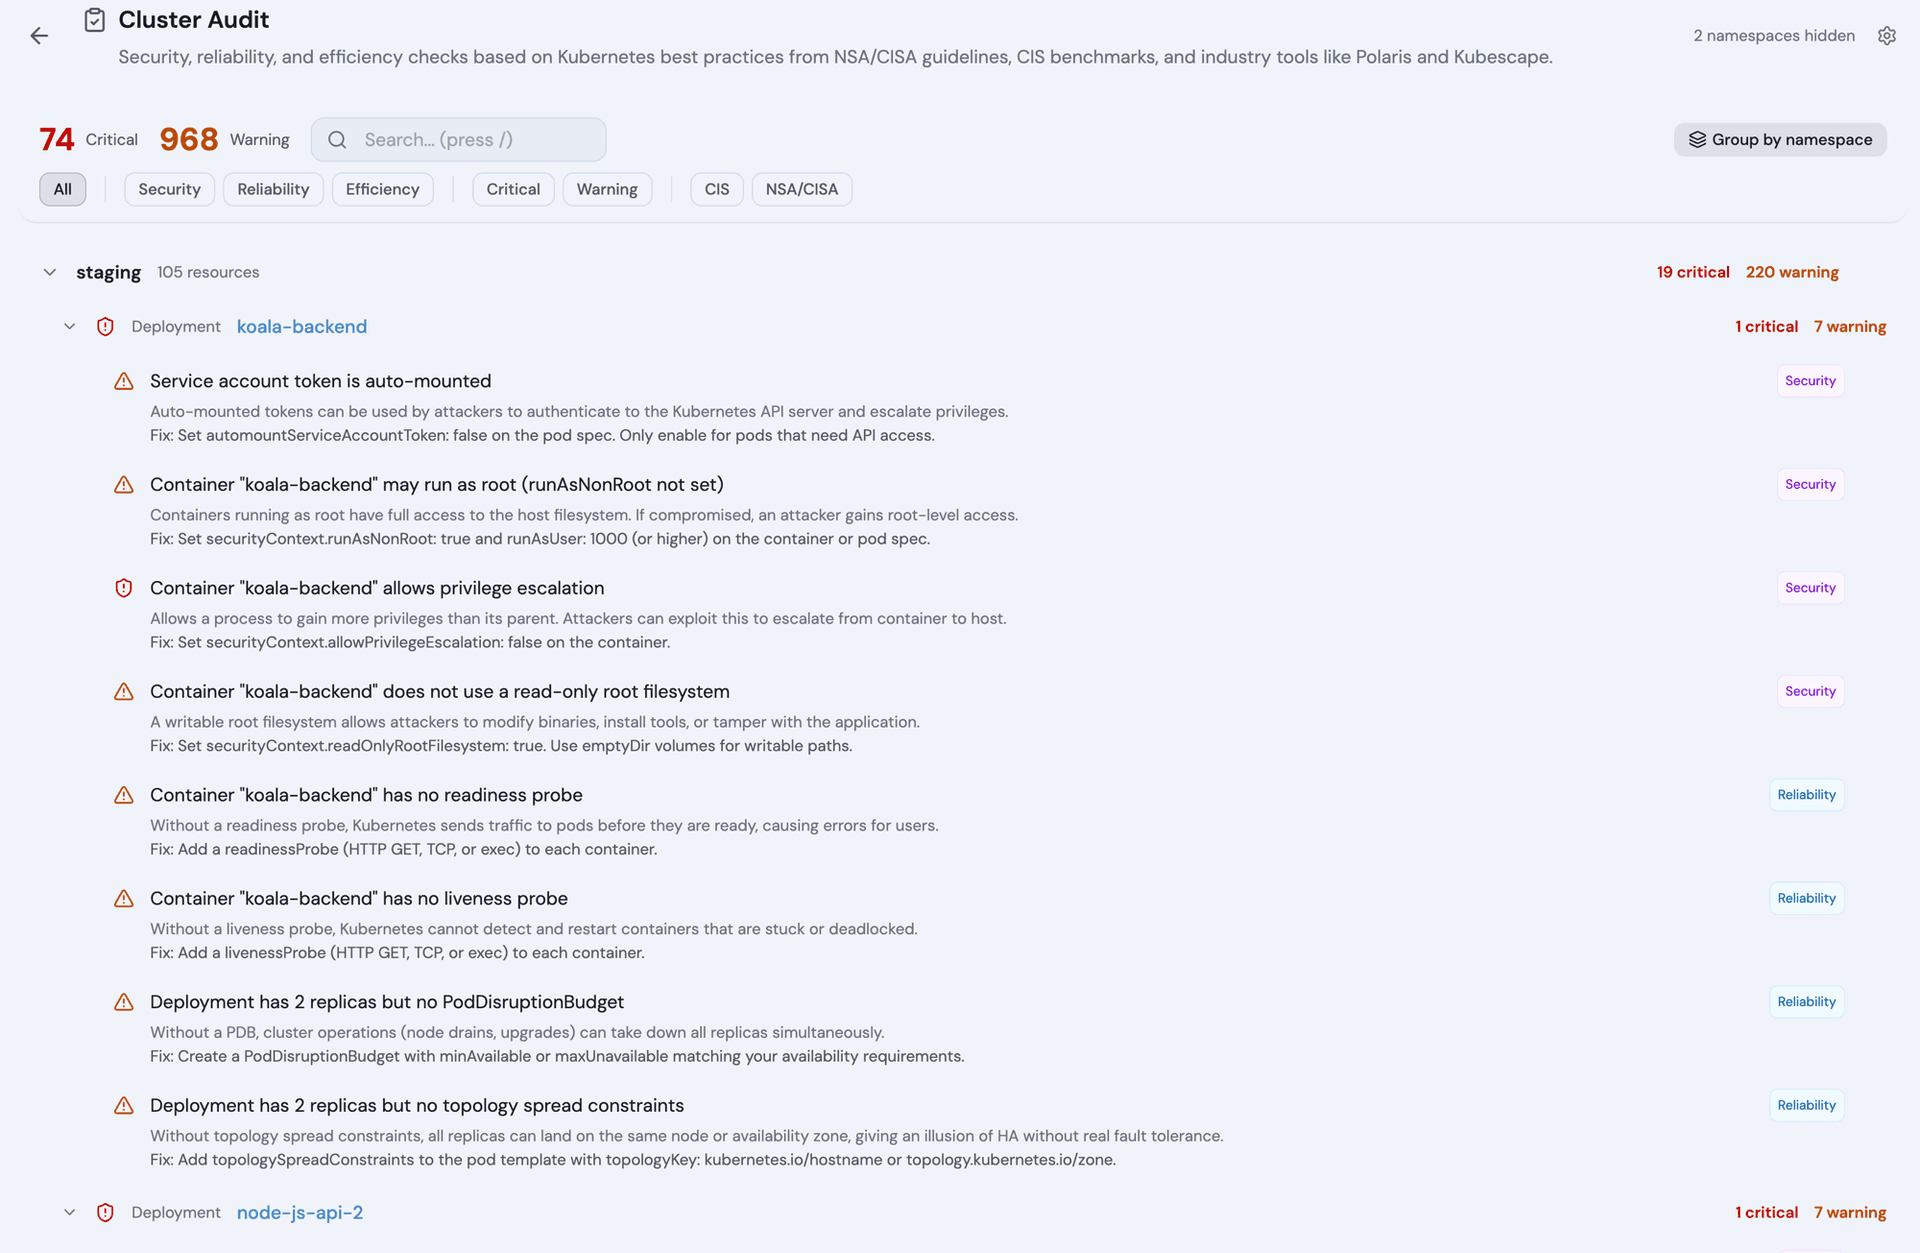
Checks
The built-in cluster audit - 44 best-practice checks across security, reliability, and efficiency, run against cached state in under a second.
Also built into the same binary.
No plugins, no bolt-ons. Auto-discovered when present, off when you don't want them.
Resource browser
Browse every workload, stream logs, exec into pods, edit YAML, port-forward. Auto-discovers any CRD via dynamic informers.
Helm release manager
Every release, every revision, every values file. Roll back, diff revisions, view history. No `helm` CLI required.
Traffic visualization
Auto-detects Hubble (Cilium), Caretta, Beyla, or Istio. Animated flow graphs with RPS, namespace + protocol filters, status-code analysis.
Cost insights (OpenCost)
Per-namespace, per-workload, per-node cost breakdown. Auto-detected when OpenCost metrics show up in Prometheus. Zero extra config.
175+ ecosystem CRDs
Built-in support for Argo CD, Flux, Karpenter, KEDA, cert-manager, Trivy, Velero, Crossplane, External Secrets, CloudNativePG, Knative, Gateway API, Istio, Traefik, Kyverno, and more. Any other CRD is auto-discovered.
The same engine, served to your agents.
Everything the views give you - issues, topology, events, resources - Radar also exposes over MCP. Your coding agent queries the live cluster through the same diagnosis engine, so it answers from real state instead of guessing - already correlated, not raw kubectl output the agent has to reassemble. And AI investigations turn that around: one click on a failing resource, and your own agent runs a read-only investigation and argues the root cause. Radar Cloud can run one for you whenever an alert rule you choose fires.
Local or in-cluster. Always airgap-ready.
Same binary on your laptop or in your cluster. No telemetry, no licensing check, no account. Your cluster data never leaves. Outbound traffic is limited to anonymous version checks when the UI opens (version plus OS/arch); block egress to releases.skyhook.io and api.github.com and Radar runs fully offline.
kubectl radarSingle native binary. Reads your kubeconfig, opens the browser, watches the cluster via SharedInformers and pushes deltas over SSE. No daemon, container, or cluster-side install.
helm installSame binary, deployed in-cluster for shared team access. OIDC or proxy auth (Google, Okta, Dex, Keycloak, oauth2-proxy, Pomerium, Cloudflare Access). Per-user K8s RBAC via impersonation.
No telemetry, no licensing calls. Outbound traffic is limited to anonymous version checks, and blocking them takes Radar fully offline for disconnected, regulated, and government clusters. Apache 2.0, audit every line yourself.
One engine, packaged for the way you work.
The same Go engine powers the CLI, local browser UI, native desktop app, and in-cluster deployment.
The frontend is embedded in the compiled Go binary. Radar Desktop uses the operating system webview instead of bundling Chromium and Node, delivering a faster, lighter desktop app for macOS, Linux, and Windows.
Same SharedInformer pattern Kubernetes controllers use, with Go's lightweight concurrency parallelizing independent work. List once, watch deltas forever - no periodic full scans, rate-limit pressure on big clusters, or UI lag while waiting for the next poll.
Cluster deltas land in your browser the instant they fire, via Server-Sent Events. No polling loop, no “click refresh,” no stale state. SSE survives corporate proxies and re-establishes on disconnect.
Close the laptop. Radar keeps watching.
Alerts, AI root cause and every cluster in one place, for you and your team, on the same open-source engine. Hosted by us, or Self-Managed in your infrastructure on Enterprise.
One alert per failure
Know when something breaks without anyone watching a dashboard. Related failures are grouped, so a crash-looping deployment is one alert, not one per pod. Delivered to Slack or any webhook.
AI investigations
A root cause with evidence, on the alert rules you choose or on demand. In our public benchmark, the same agent diagnosed faults 3× faster on average with Radar than with plain kubectl. 100 a month free.
Your team
Share any view with just a link, scoped by your existing Kubernetes RBAC, so nobody hands out a kubeconfig. Invite the whole team: every plan has unlimited users and Google or GitHub sign-in.
Every cluster
The whole fleet in one view: issues, checks, certificates, packages and search across every cluster, a side-by-side diff when staging and prod disagree, and one MCP endpoint for your agents.
History
Events and changes kept long after Kubernetes deletes them, up to 30 days. See what changed in the hour before an incident, on any cluster, even after the pods involved are gone.
Enterprise-ready
SOC 2 on every plan, SSO and SCIM on Enterprise, and an audit log kept 30 days on Team and 1 year on Enterprise. Or run Radar Cloud in your own infrastructure with Self-Managed.
What's already in your stack.
Radar meets the stack you already run: cluster tooling it auto-detects and renders natively, the platforms it runs on, and the identity providers you sign in through. A selection:


















37 GPU scheduling, batch, training, and inference kinds get tailored tables and status. Every other CRD stays fully browsable. Full integration coverage in the docs
Questions we get about Radar.
Is Radar really free, or is the open-source version a limited trial of Cloud?
Does Radar phone home or send cluster data anywhere?
Can Radar run fully airgapped?
What's the difference between running it locally vs in-cluster?
What does Radar Cloud add that OSS doesn't have?
Bring your first cluster online in 60 seconds.
Install the Helm chart, paste a token, and Radar Cloud starts watching. No credit card required.
Apache 2.0 · Run Radar OSS forever · Radar Cloud for you, your team and every cluster