Your cluster, drawn automatically. Live.
Every Deployment, Service, Ingress, and CRD - laid out by ELK.js, updated via Server-Sent Events, groupable by namespace or label. Open-source, runs on your laptop, installs in 30 seconds.
kubectl tells you what. It doesn't tell you how things connect.
You can kubectl get ingress, then kubectl describe to find the Service, then grep the selector, then get pods matching those labels, then maybe notice the Service actually points at a different namespace because someone overrode the externalName. Five commands in, you've lost track of what you were trying to answer.
The information is there. The graph is implicit in every YAML on disk. It just doesn't render anywhere.
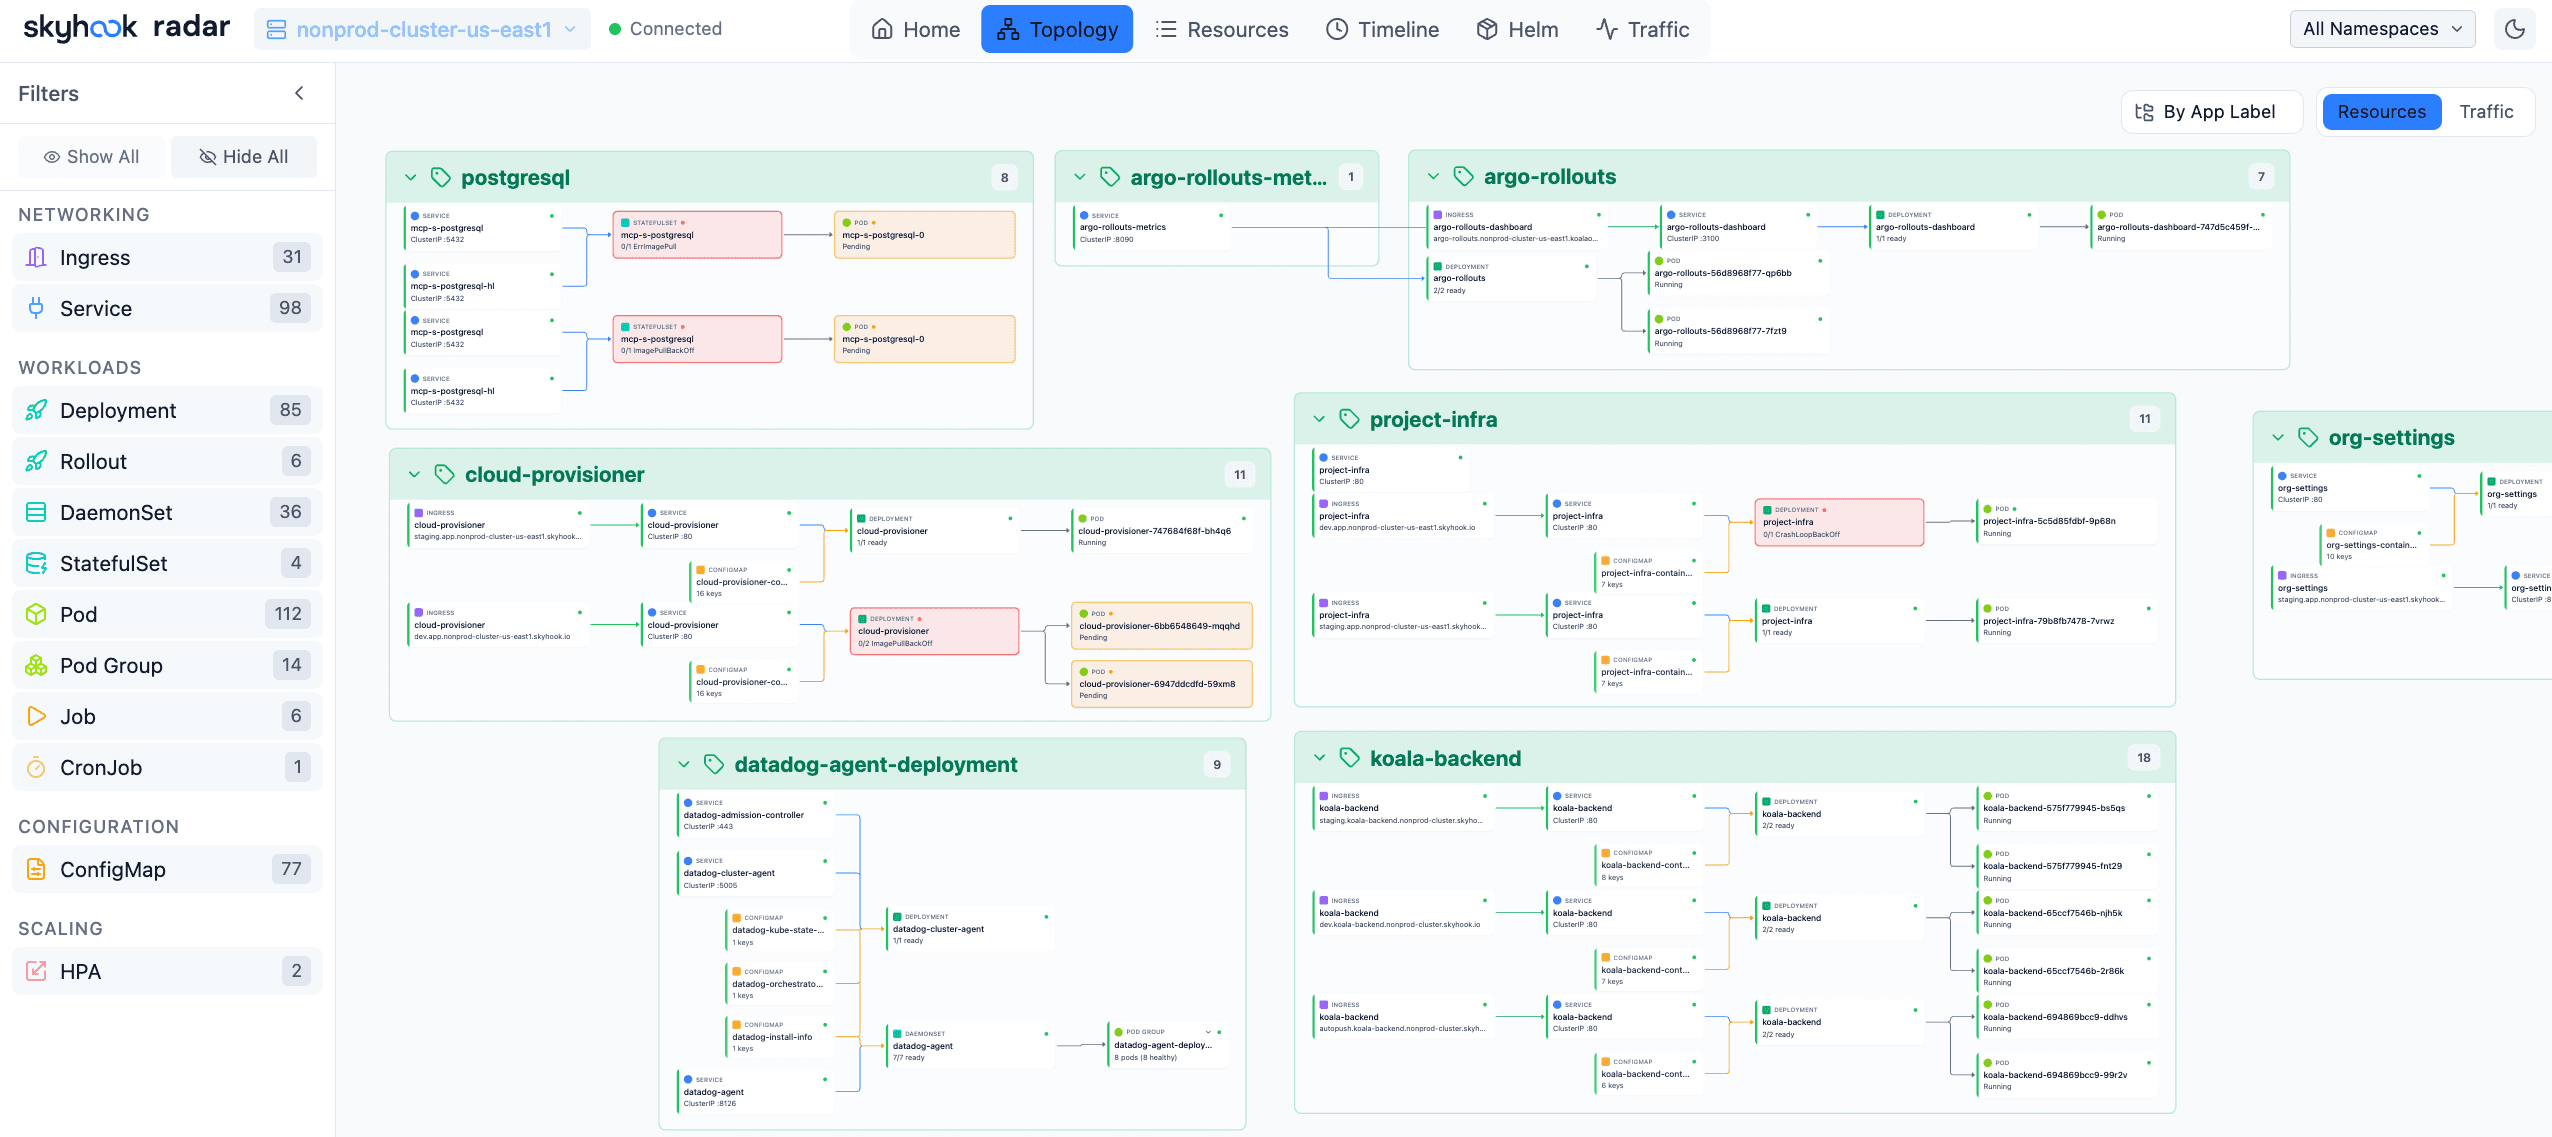
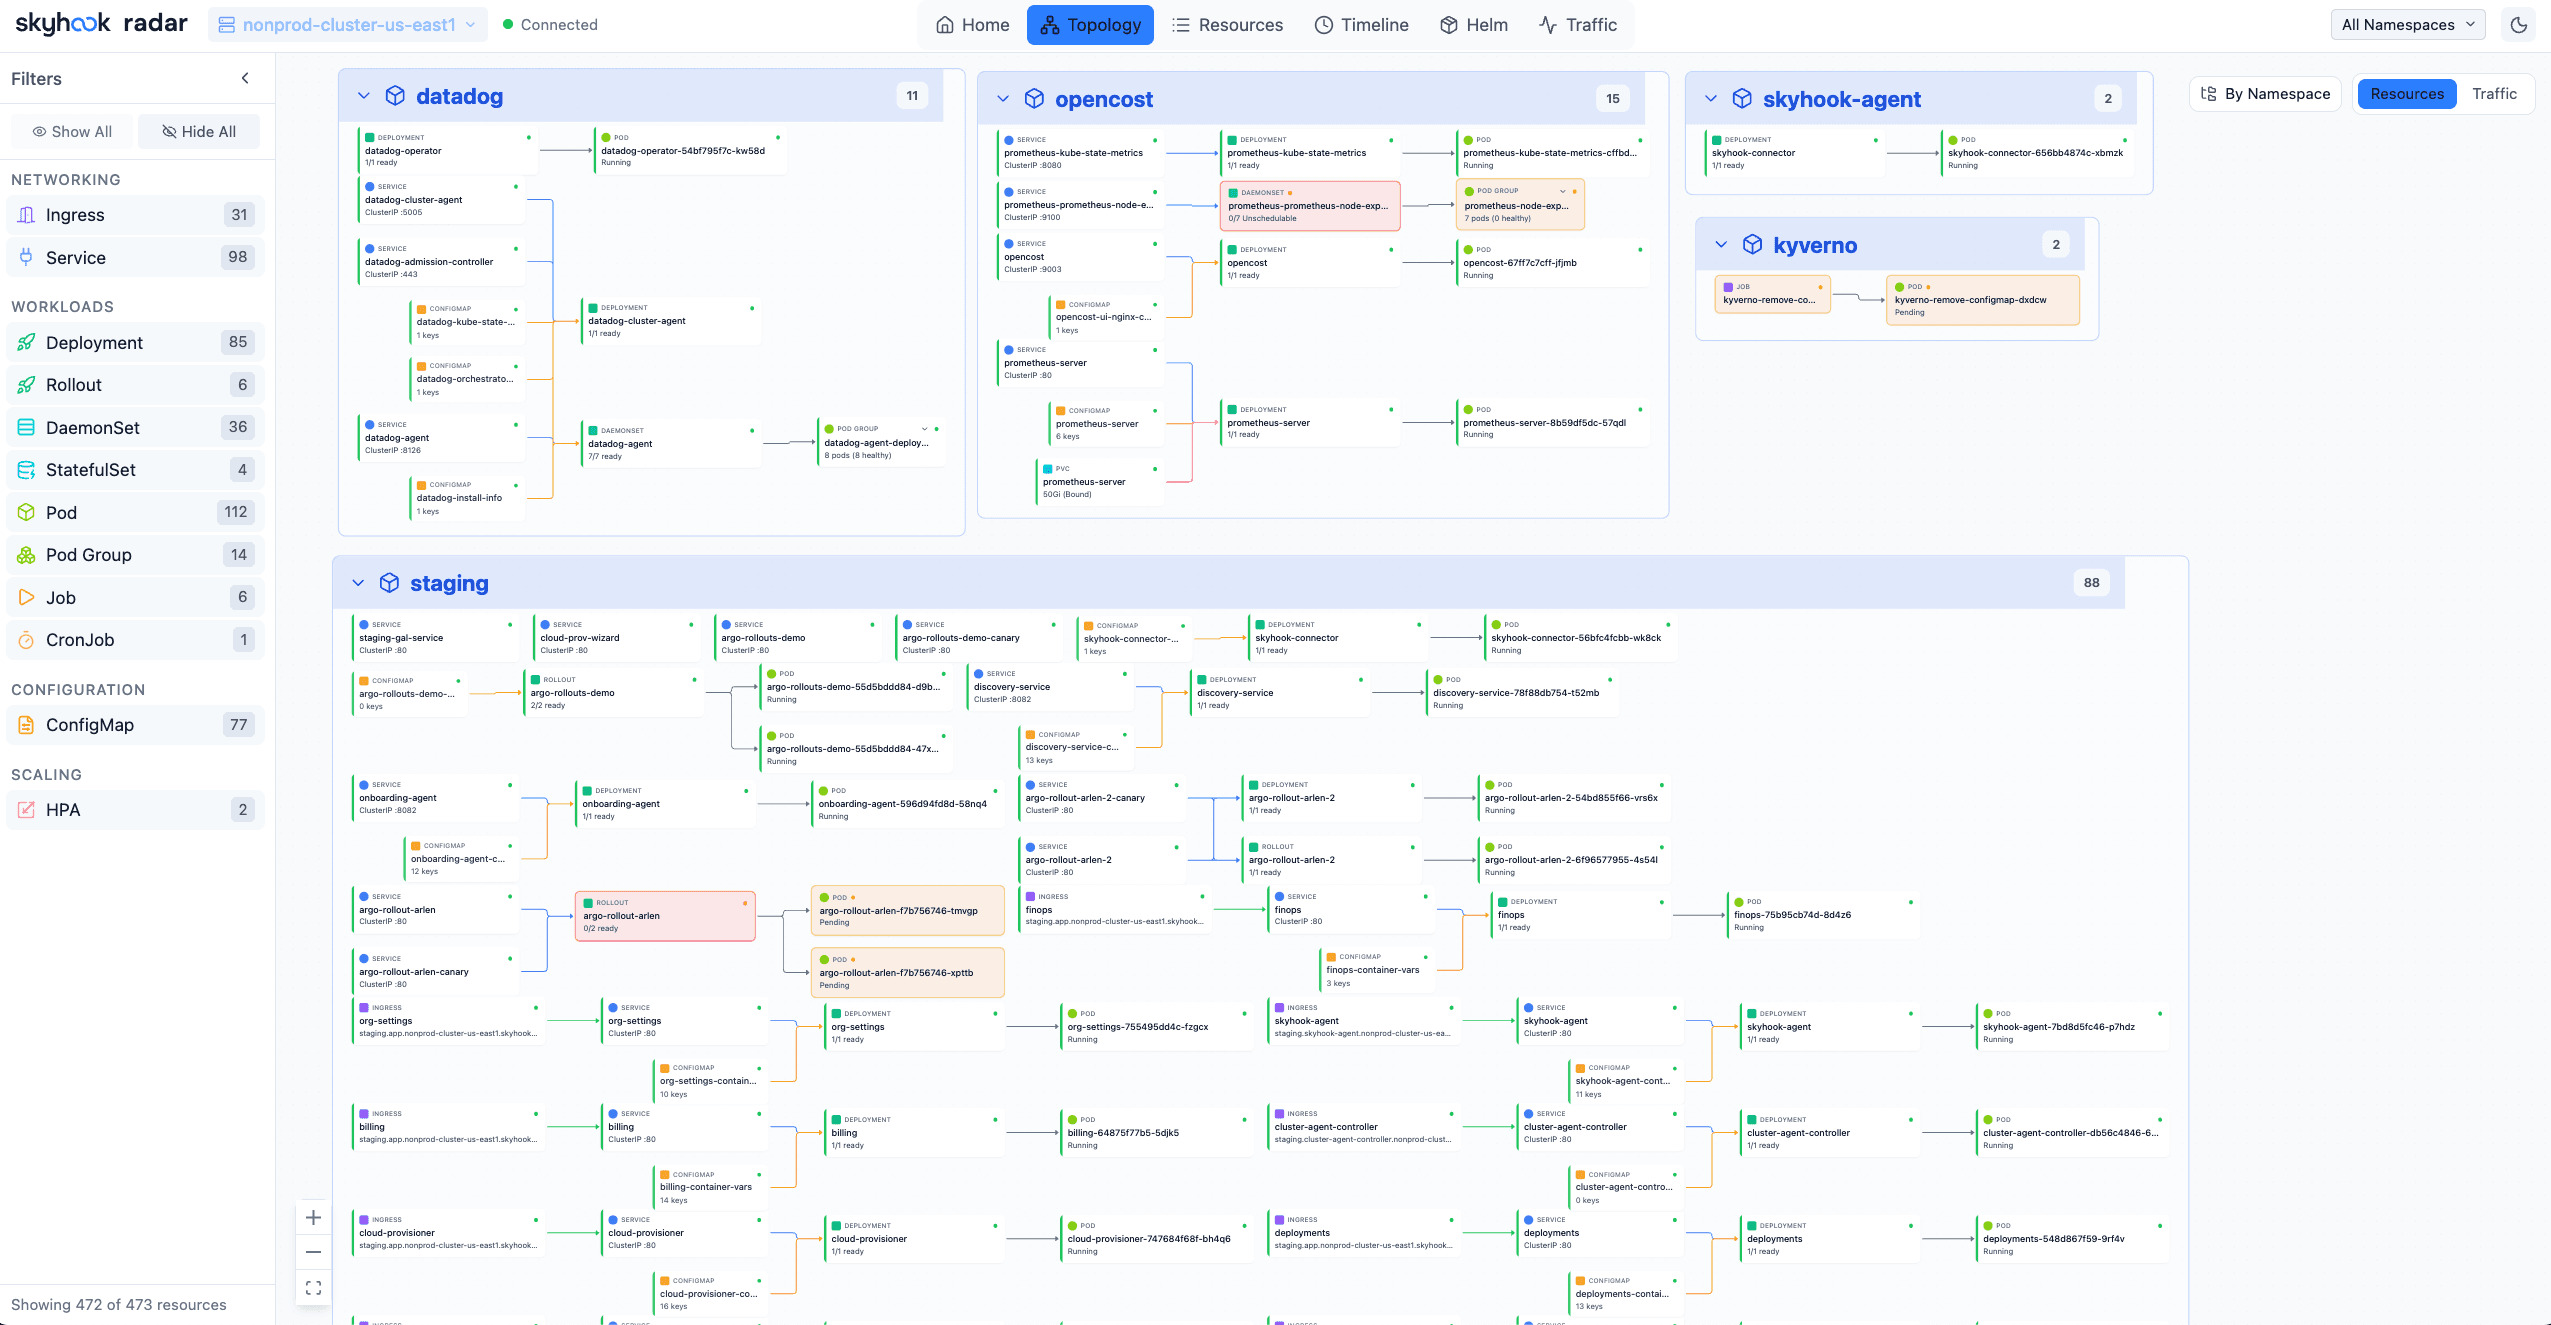
Radar draws it. Every node is a real resource, every edge is a real relationship, everything is clickable, everything updates without a reload. The thing you've been mentally reconstructing every time you open a terminal - that's the default view.
Read the cluster like a map.
Resources mode + Traffic mode
One view per question. Resources mode shows the ownership DAG - which Deployment owns which Pod, which Service routes to which workload, which Ingress resolves where. Traffic mode shows live flows between services (via Hubble, Caretta, or Istio) with animated RPS.
Group by namespace, app label, or ungrouped
On a 20-namespace cluster the ungrouped view is noise. Flip to namespace grouping and the graph collapses into visual districts. Group by `app.kubernetes.io/name` and you see logical services regardless of which namespace they live in.
Live over SSE
Radar watches your cluster through SharedInformers (the same client-go pattern controllers use) and pushes changes to the browser over Server-Sent Events. A pod going Ready shows up on the graph without a refresh.
Filter by kind, name, or status
Hide Jobs and ReplicaSets when you only care about live workloads. Search by name. Highlight resources in `CrashLoopBackOff` or `ImagePullBackOff`. The graph is the query; the filters are the WHERE clause.
Click any node to open its detail view
Nodes aren't just labels - they're clickable handles into the full resource inspector. YAML, logs, events, related resources, live exec. The graph is your entry point, not your destination.
Custom resources auto-discovered
Argo Rollouts, Flux Kustomizations, Istio VirtualServices, Karpenter NodePools, cert-manager Certificates, your own CRDs - all appear in topology without plugins, via dynamic informers.
Why the graph feels fast.
Three engineering decisions that show up in the UX.
SharedInformers, not polling
Same client-go pattern a Kubernetes controller uses. List once, watch deltas forever. No duplicated API calls, no periodic full scans, no rate limits being tripped on large clusters.
ELK.js auto-layout
The layered graph layout algorithm from Eclipse Layout Kernel, in the browser. Relayouts incrementally as the cluster changes - and when the graph gets big, grouping collapses it into districts instead of spaghetti.
SSE push, not WebSocket
Server-Sent Events survive corporate proxies, re-establish automatically on disconnect, and don't require a second protocol stack. Updates land in the browser as they happen.
Flip the grouping. Same data, different story.
The same cluster can be read as a namespace map, a service-label map, or a flat resource graph. Radar keeps all three one click apart. The mode that makes sense for a calm overview is not the mode that makes sense mid-incident.
- Namespace - collapses the graph into per-namespace districts. Best for ops overview.
- App label - groups by
app.kubernetes.io/name. Best when services span namespaces. - Ungrouped - raw DAG. Best for debugging ownership or label chaos.
Apache 2.0. Yours to inspect, fork, or self-host.
Radar's source is on GitHub. Every feature on this page is in the binary you install with brew install. No telemetry, no mandatory login, no cluster data out. The one outbound call is an anonymous version check when the UI opens. If we ever change that, you'll see it in a diff first.
Radar Cloud adds the multi-cluster layer on top.
The topology view stays the same. What Radar Cloud adds: one workspace for every cluster, shared deep-links your team can paste into Slack, retention that survives restarts, and RBAC scoped per-namespace instead of whoever-holds-the-kubeconfig.
See what Radar Cloud adds vs OSSQuestions we get about topology.
Does the topology graph update in real time?
Does it work with GitOps, service mesh, and other custom resources?
Can I see live traffic between services, not just ownership?
How does topology stay readable on a large, multi-namespace cluster?
Do I need an account or Radar Cloud subscription to use topology?
More of what Radar does in the same binary.
Issues & root cause
Failures grouped by subject, folded to the cause, with blast radius.
Applications view
Workloads folded into the apps they form, with health rollups and env skew.
GitOps for Argo + Flux
Fleet + per-app diagnosis with field-level drift, controller attribution, and lifecycle awareness.
Event timeline
Every K8s event and resource change, retained past the 1-hour TTL.
The graph you've been drawing in your head.
Radar renders it for you. brew install, and you're looking at your cluster in 30 seconds.
Apache 2.0 OSS · Unlimited clusters self-hosted · Hosted free tier for up to 3 clusters