One question: what's actually broken?
Radar folds a cluster's failures into a triage queue with the root cause on top - deterministically, with classification rules over live state, not an LLM guessing. When Radar isn't sure, the row says so.
How an incident reads in Radar.
- 11:42
The pager fires. kubectl shows a wall of red.
checkout is down. Four things look broken at once: the Deployment reports degraded, two pods are in CrashLoopBackOff, and the ArgoCD app failed its last sync. Four alarms. You don't know yet that they're one problem.
- 11:43
The queue has already done the join.
Open Issues. Not four rows - one: the Deployment, marked critical, with its crashlooping pods folded underneath and the failed sync linked to it. Same-subject grouping folded the symptoms; the causal link carries a confidence label so you know how sure Radar is.
- 11:44
The row names the cause - and the next step.
Expand it. WHAT'S WRONG: container OOMKilled, with when it started and when it was last seen. NEXT STEP: the concrete action, not a link to a runbook. And the part that usually takes longest to find: the meaningful change that preceded it - a memory-limit edit, minutes before the first restart.
- 11:47
Revert, watch the queue clear itself.
The Issues view is live state, not an alert log. When the fix lands and pods go healthy, the row disappears on its own - no acknowledging, no resolving, no stale incidents to clean up after the postmortem.
Illustrative incident; the diagnosis mechanics are the shipped ones.
The queue, on a real cluster
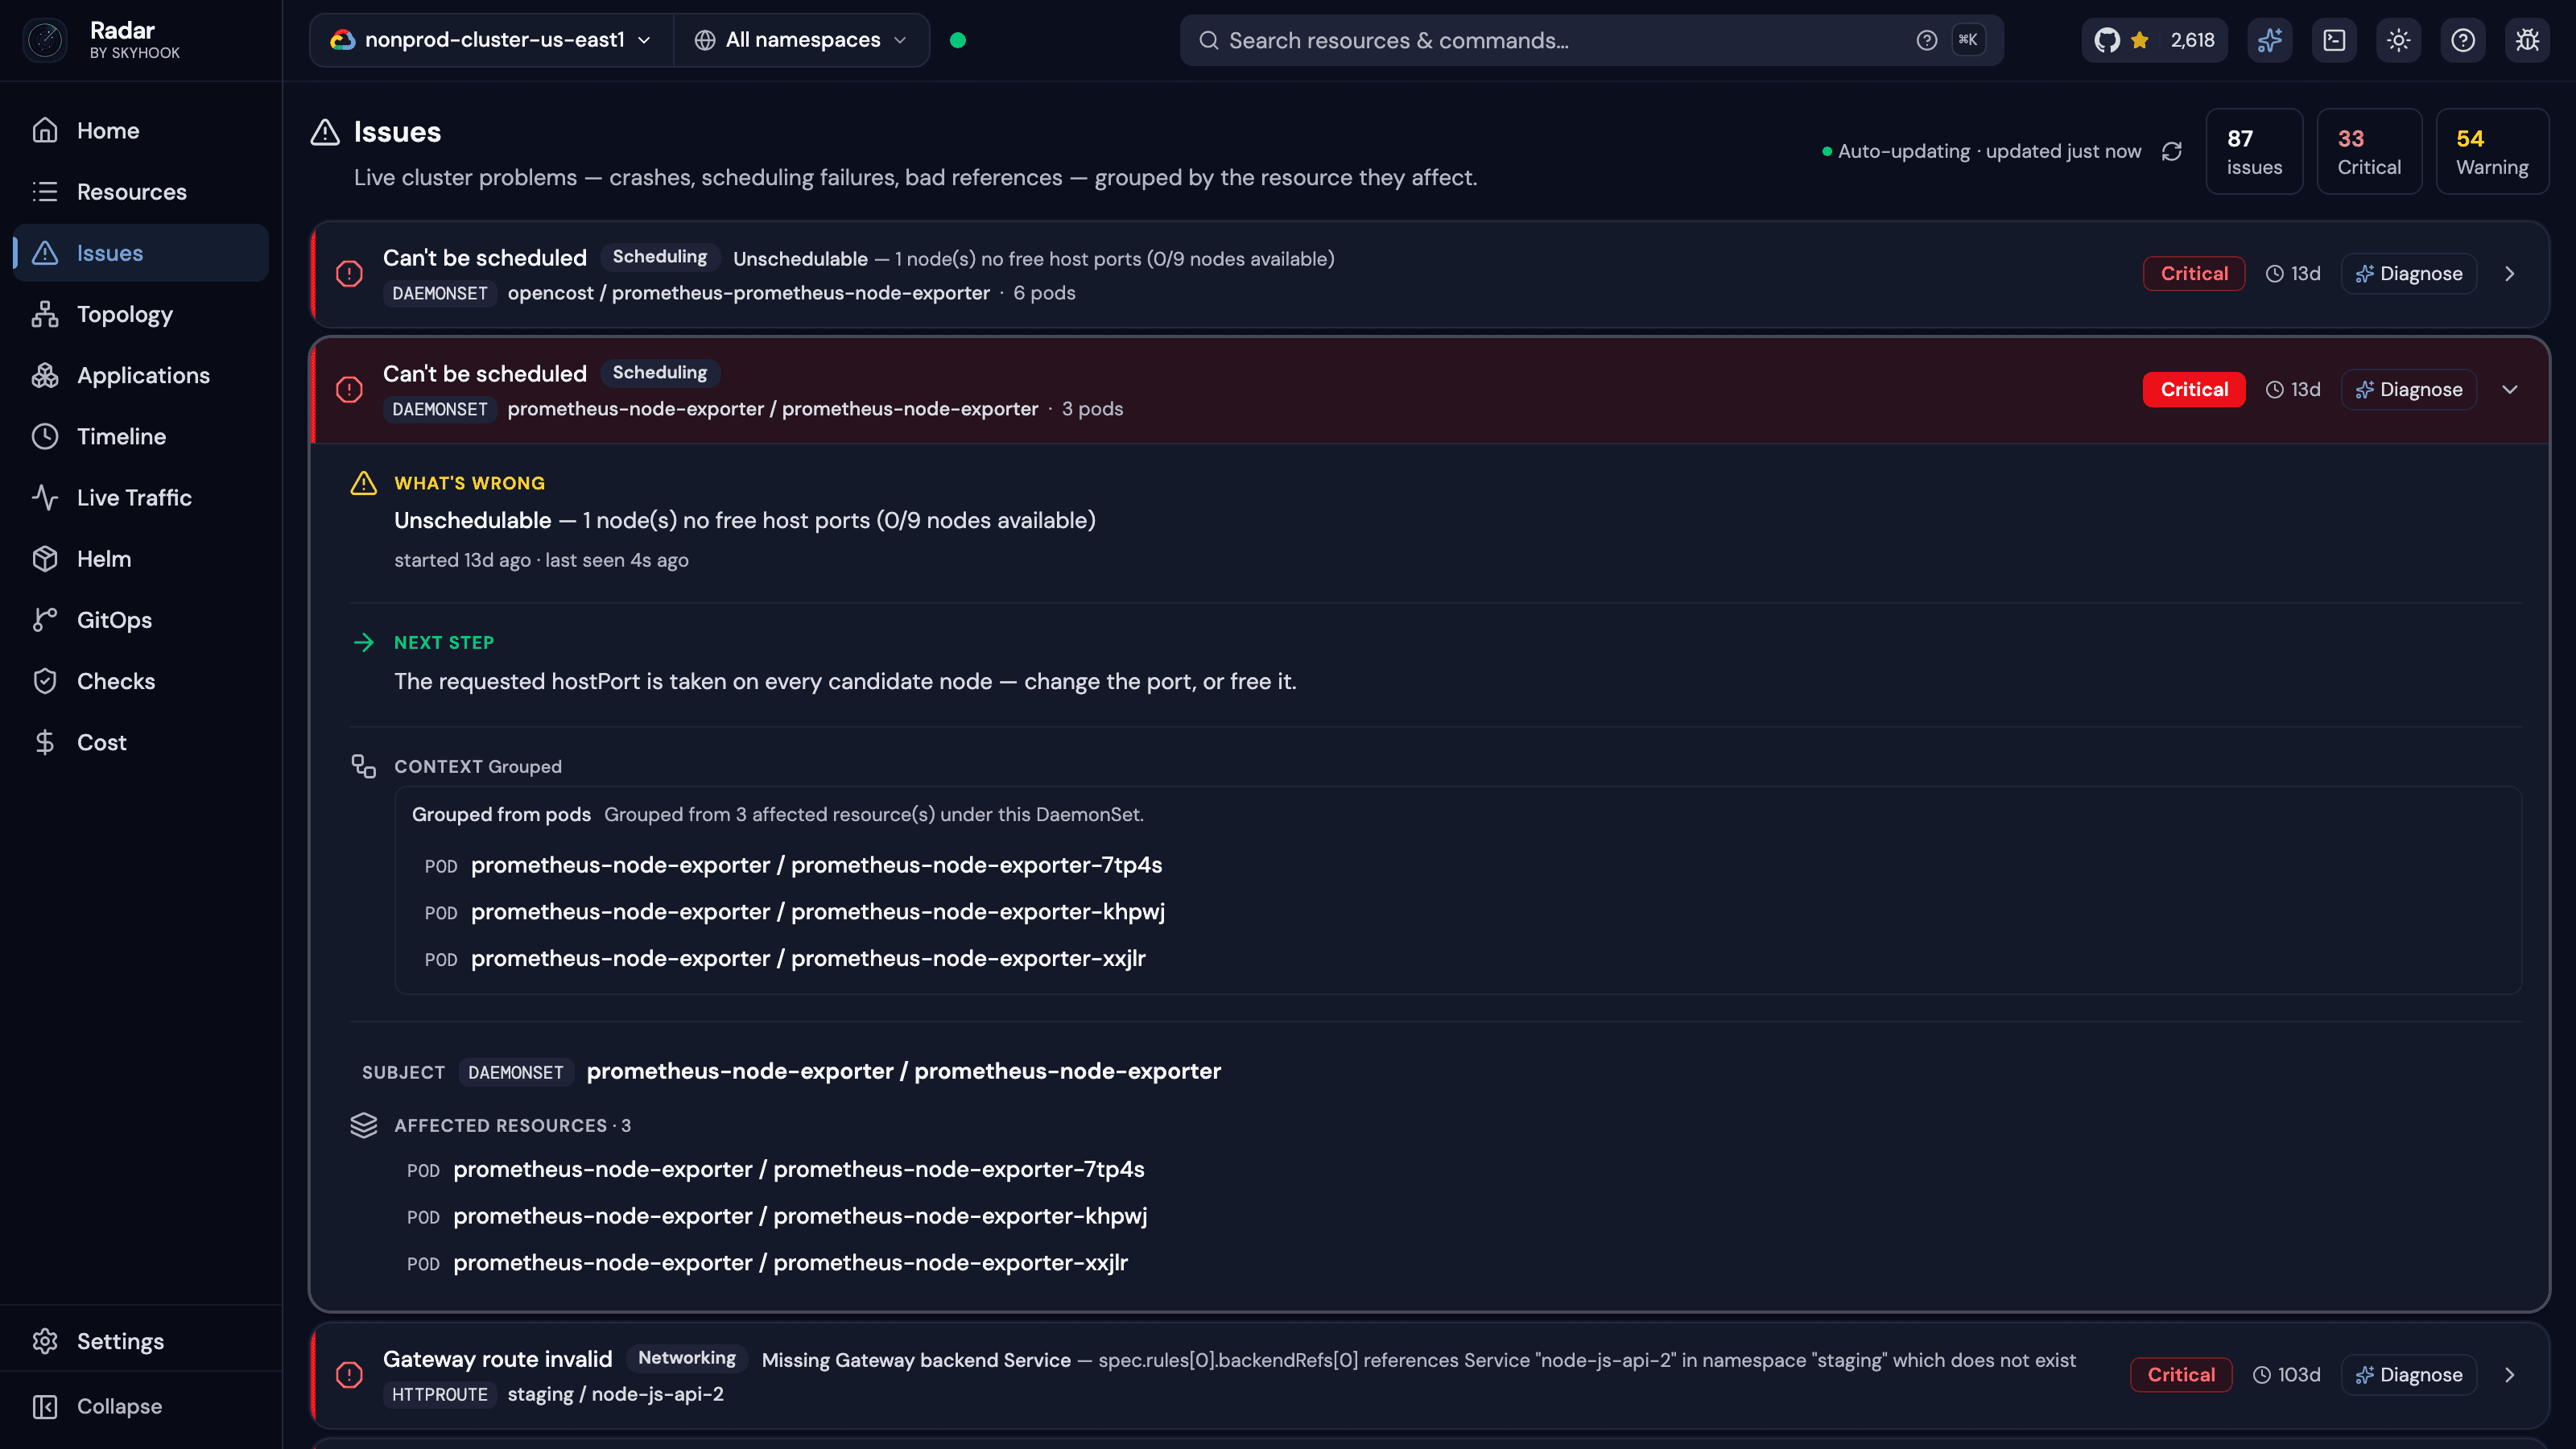
Grouped from three pods into one row, with the next step included.
The blast radius, linked
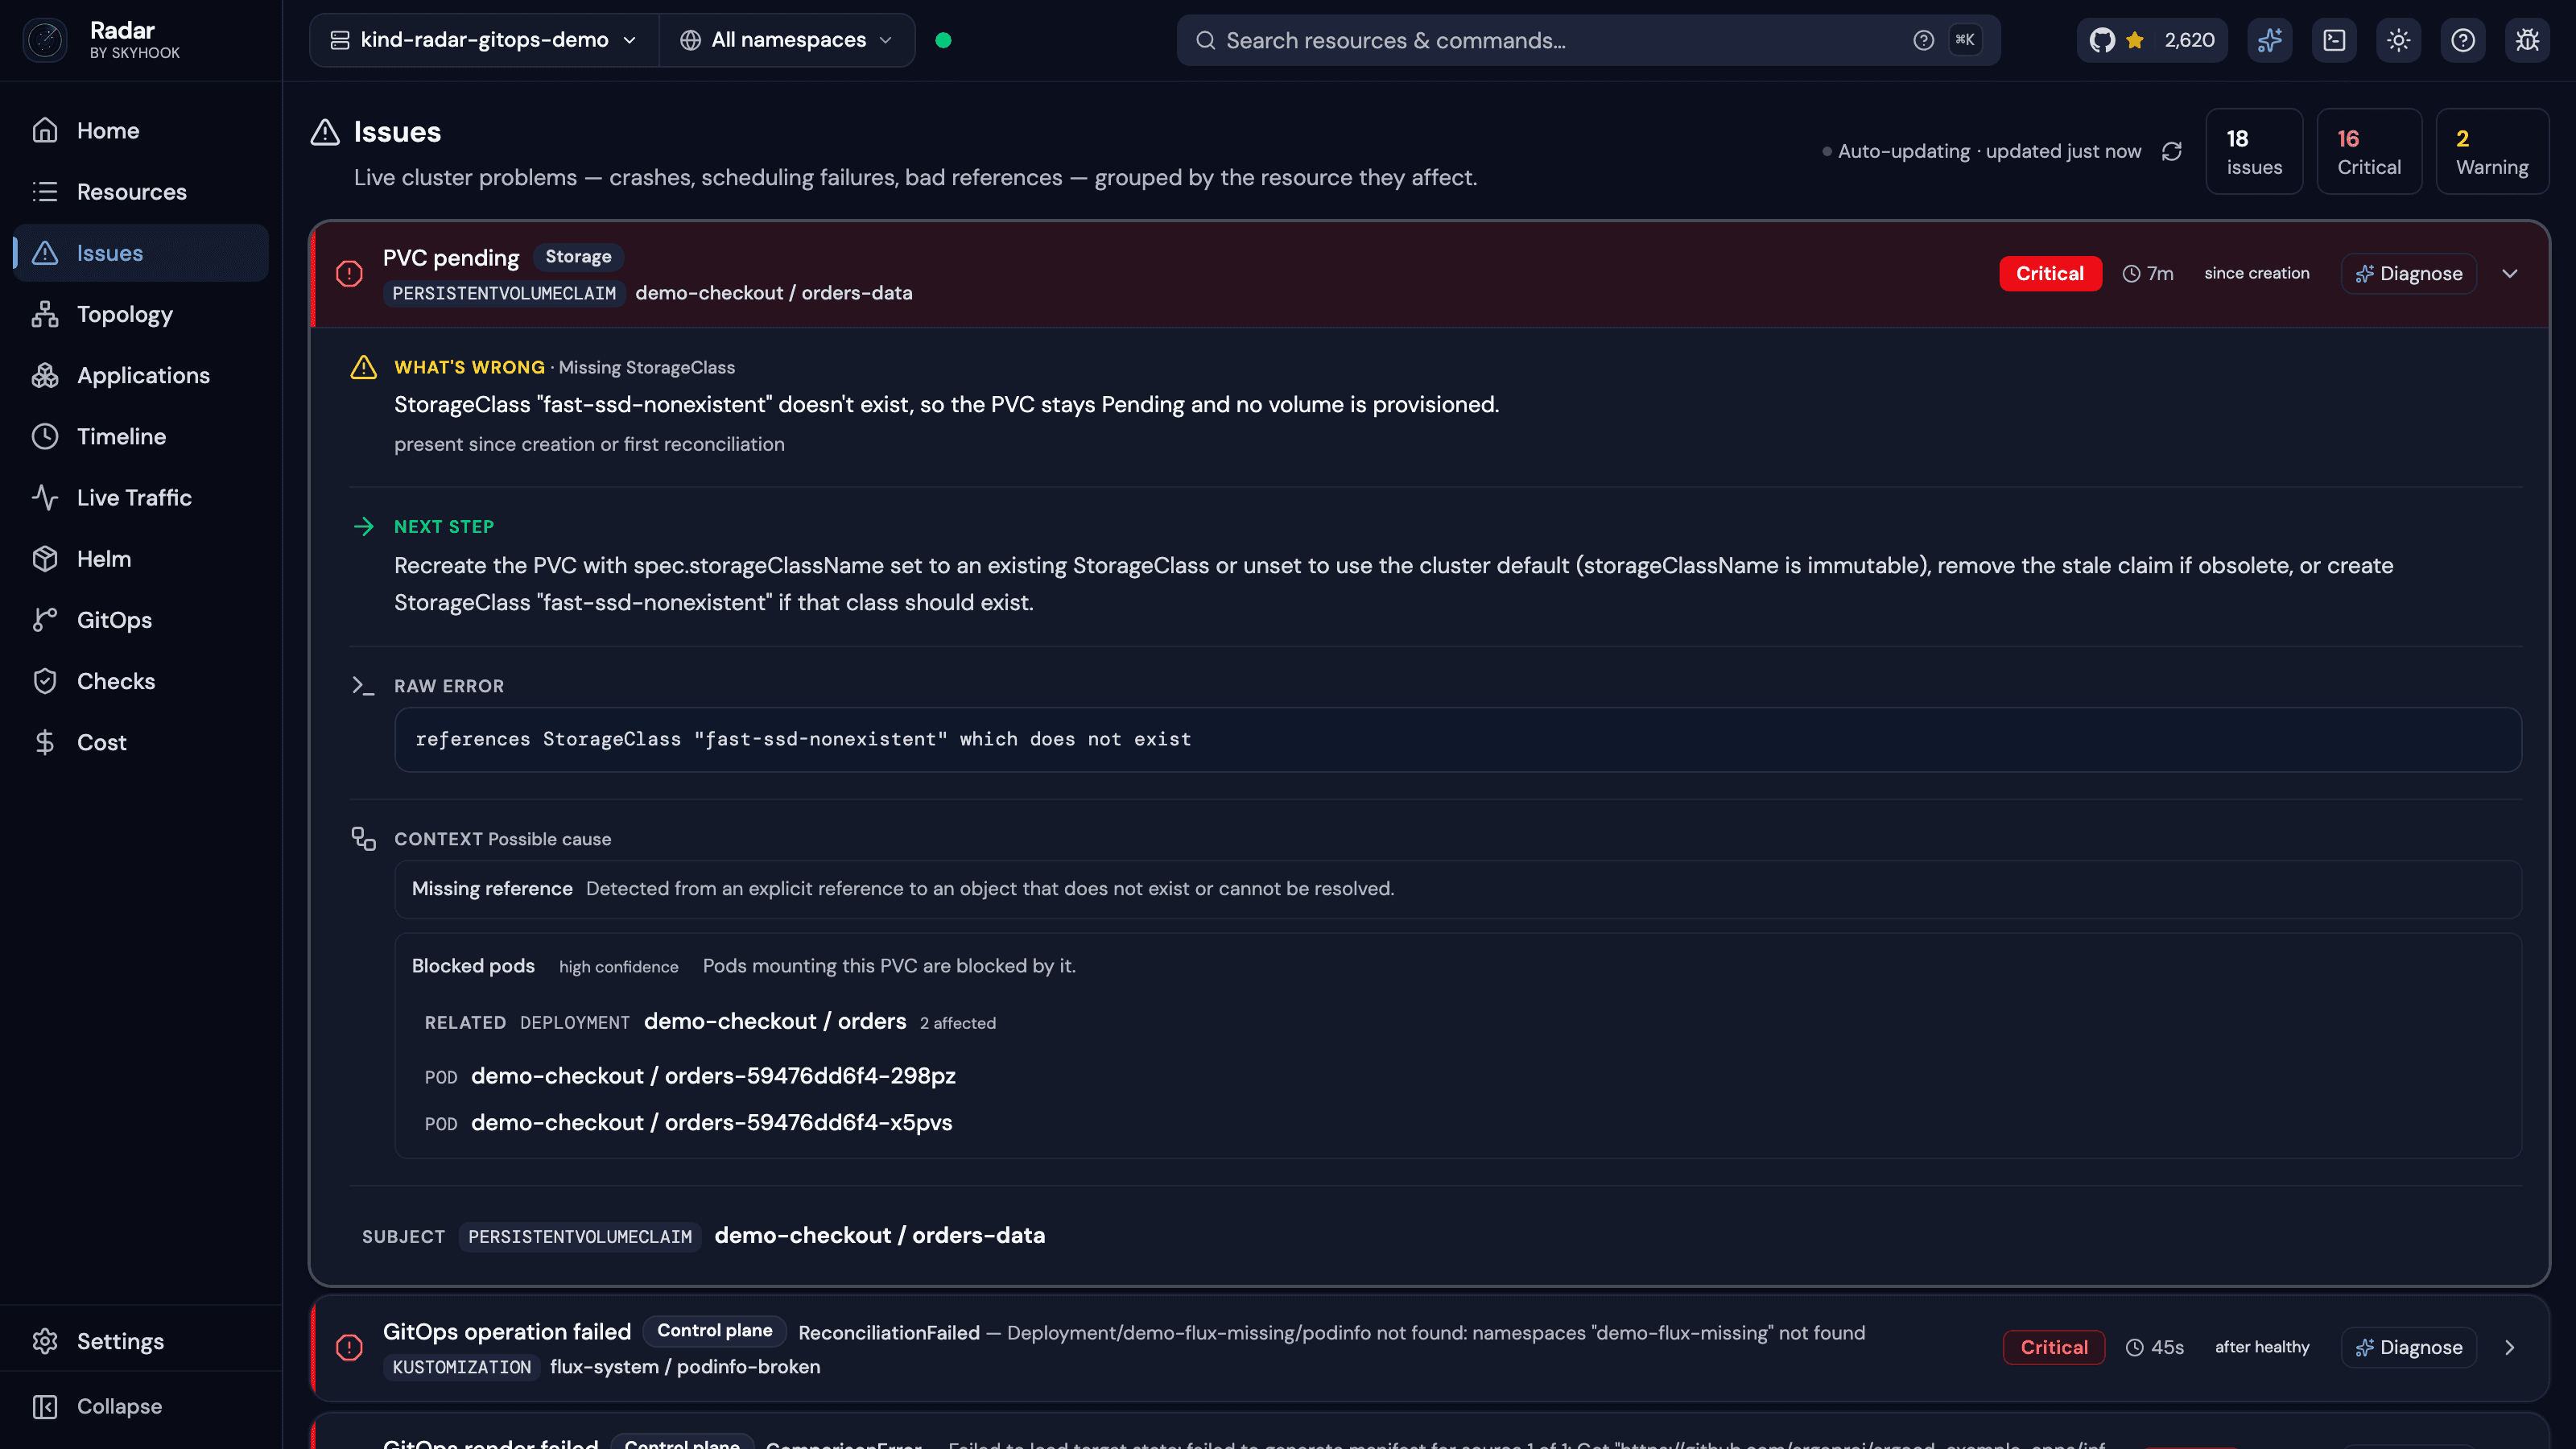
A broken PVC, and the deployment and pods it's blocking - linked, with the confidence stated (“high confidence”), plus the exact next step.
See your own cluster's queue in one command: curl -fsSL https://get.radarhq.io | sh && kubectl radar
Deterministic diagnosis, honest confidence.
Rules, not a model
Diagnoses are deterministic signals computed from the state and events Radar already watches. The same failure produces the same diagnosis every time - with the underlying kubelet and status detail (evictions, image-pull errors, config errors, probe failures) carried alongside Radar's stable labels.
Confidence you can see
Every cross-resource causal link carries its confidence - when Radar isn't sure the node is what took your pods down, the link says so instead of asserting it. And a fold never lowers severity.
Wired into everything
Issues appear in each resource's detail view and on the home dashboard, not only in the cluster-wide queue. Helm install/upgrade failures surface as first-class issues. AI agents read the same diagnoses over Radar's MCP server.
This is the part Lens and similar tools leave to you: they hand you the raw materials - an events view, metrics, logs - and, lately, an AI chat to reason about them. Radar ships the diagnosis itself: a deterministic queue, folded and linked, the same answer every time. And when you do want a model on the case, an AI investigation starts from these diagnoses rather than raw materials, with the deterministic queue still underneath.
What the engine catches, beyond one incident.
The same classifier runs across the quieter failures teams usually miss - not just the loud crashloops:
- Same-subject grouping - a fold never lowers severity
- Causal links across resources, each carrying a stated confidence
- Cause and action for crashloop exit codes, image-pull failures, and admission blockers (quota, webhooks, Pod Security)
- Pods that bind to a node and stall silently - no events at all - caught too
- Explicit HPA diagnosis: maxed-out, can't-read-metrics, pinned, paused
- GitOps sync failures and stalled rollouts, with the triggering change
- Any CRD's .status.conditions gone False - Argo, Flux, Knative, Crossplane, cert-manager, KEDA - caught by the generic fallback
Questions we get about Issues.
Is the Issues engine AI-based?
How is this different from alerting?
What failure types does Radar diagnose?
Does one incident flood the queue with rows?
What does Radar Cloud add on top?
Running a fleet? Radar Cloud rolls every cluster's Issues into one shared triage queue with alerts.
All 50 benchmark scenarios started here. When we put an AI agent on 50 live cluster faults, it opened with this ranked stream every single time, before it had any idea where to look. The same agent with raw kubectl had nowhere to start.
More of what Radar does in the same binary.
Triage the cause, not the symptoms.
The failures are already classified, folded, and linked. Open the queue.
Apache 2.0 OSS · Unlimited clusters with Radar OSS · Hosted free tier for up to 3 clusters