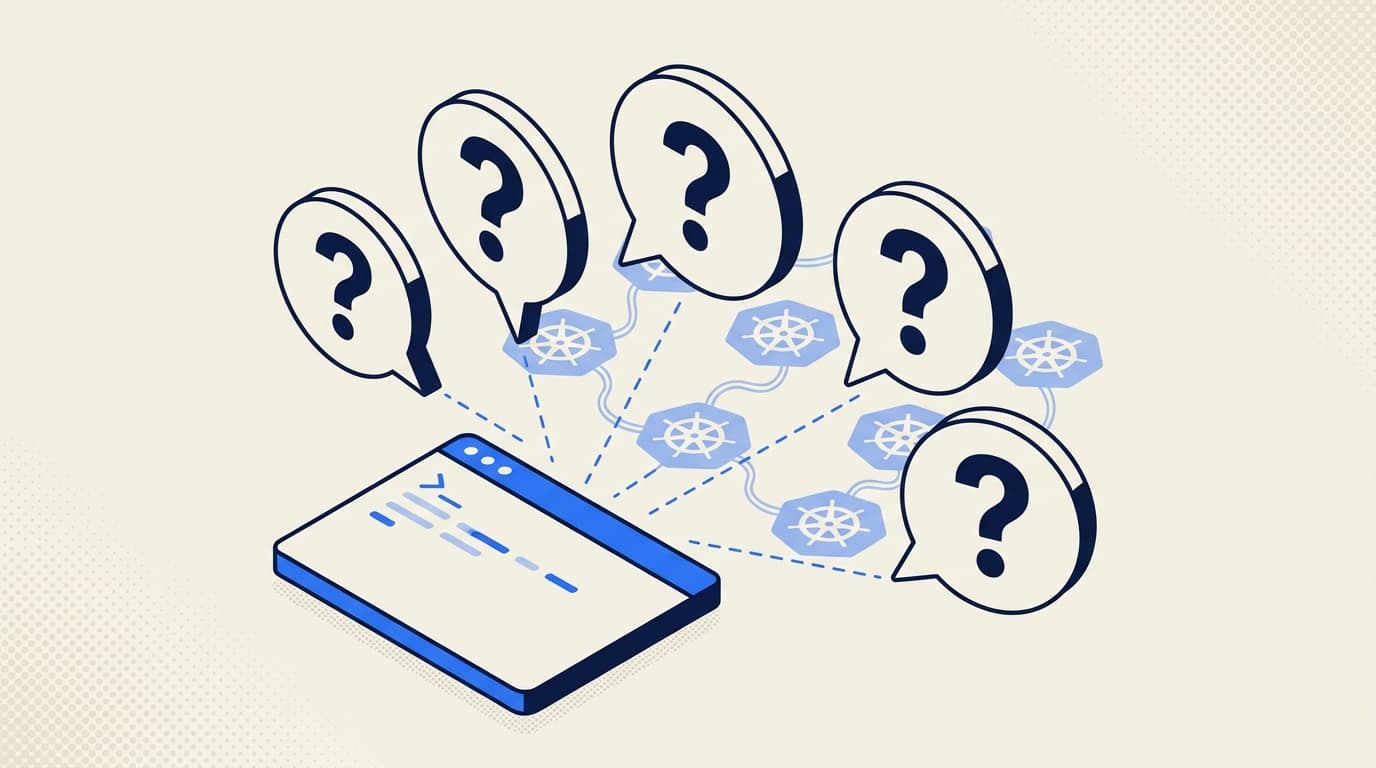
Five Questions You Can't Answer With kubectl
kubectl hands you one object at a time, as raw YAML. Here are five questions - relationships, isolation, image contents, history, posture - where that runs out of road.
kubectl is the right tool for almost everything. It is also, by design, a way to fetch one object at a time, as raw YAML, exactly as it exists right now.
Often that is precisely what you want. You are debugging one pod, in one namespace, checking its current state. kubectl is fast, scriptable, and built into every engineer's brain. Nothing is going to replace it.
But a Kubernetes cluster is not a list of objects - it is a living, interconnected graph, and a lot of the questions that matter are about the graph, not any single node of it. How do these objects relate? How do they actually behave, versus what their YAML declares? What is inside the artifacts they run? What did they look like an hour ago? Are they configured sensibly? kubectl can hand you the raw material for each, but it leaves the assembly to you. Here are five questions where that gap shows - all real ones our users brought us this year.
1. "What actually breaks if I change this?"
You are about to edit a ConfigMap, retarget a Service selector, or delete what looks like an unused Secret. What depends on it?
kubectl shows you the object:
kubectl get configmap app-config -n payments -o yamlWhat it will not show you is the blast radius. To find that you go spelunking: which Pods mount this ConfigMap as a volume or pull it via envFrom, which Deployments own those Pods, which Service selects them, which Ingress routes to that Service. Each hop is a separate query, and the references run in directions JSONPath makes you walk by hand:
# which pods reference this ConfigMap? (volumes AND envFrom AND env valueFrom)
kubectl get pods -n payments -o json | jq '.items[] | select(
    (.spec.volumes[]?.configMap.name == "app-config") or
    (.spec.containers[].envFrom[]?.configMapRef.name == "app-config") or
    (.spec.containers[].env[]?.valueFrom.configMapKeyRef.name == "app-config")
  ) | .metadata.name'
That is one level, one kind of reference, one ConfigMap. The actual question - "show me everything connected to this, and how" - is a graph traversal, and kubectl returns objects, not graphs.
What you need is the cluster rendered as what it is: a graph of typed relationships. Radar's topology view models the edges between objects - which controller manages a workload, which Service exposes it, which ConfigMaps and Secrets configure it, which PDB or NetworkPolicy protects it, and the HPA it uses to scale - and lets you click any node to see everything wired to it. "What breaks if I touch this" becomes "look at the node and read its edges," instead of a dozen correlated jq queries you have to remember to keep in sync.
2. "Is this pod actually isolated, or wide open?"
Security asks: is the payments workload locked down, or can things reach it that shouldn't?
kubectl lists the policies:
kubectl get networkpolicies -n payments -o yamlNow read the podSelectors, intersect them with the labels on the workloads you care about, cross-reference the ingress and egress rules and their namespace/pod selectors, and hold the result in your head. The most dangerous case is the absence of a policy - a workload that nothing selects, so it is wide open - and "find me the Pods that no NetworkPolicy covers" is not a query kubectl offers. You would enumerate every Pod, enumerate every policy's selector, and compute the set difference yourself. And even then you have only checked declared intent, not what is actually talking to that pod right now.
What you need is coverage plus reality. Radar flags which workloads have no NetworkPolicy selecting them - the wide-open ones - shows what each policy does cover, and, where you run Cilium's Hubble, Caretta, or Istio, overlays live traffic on top. "Nothing is protecting this destination, and here is what is currently reaching it anyway" becomes one view instead of a YAML reasoning exercise.
3. "What's actually inside this image?"
Trivy flags a critical CVE in a library. Is the vulnerable file even present in the image you ship, or did it come from a base layer you stripped? And while you are in there - why is this image 1.4GB?
kubectl's answer is exec, which only works if the container is running and ships a shell:
kubectl exec -it payments-api-7d9c8b4f-xq2mn -n payments -- /bin/sh
# sh: not found
Distroless image? No shell. Pod crash-looping? Nothing to exec into. Image not scheduled anywhere yet? Nothing to exec into at all. The thing you want to inspect is the image's filesystem, and kubectl operates on running containers, not image artifacts.
What you need is to read the image itself. Radar's image filesystem viewer lets you click any container image in a Pod and browse its complete filesystem - the full tree, with file sizes, permissions, and symlink targets - without pulling it locally or execing into anything. "Is libfoo.so.1.2.3 actually in here" and "what are the ten biggest paths" become point-and-click, on any image, running or not.
4. "What changed last night?"
You walk in at 9am. Webhook delivery has been flaky since 2am. The on-call engineer has gone to bed. You want a timeline.
kubectl --context=prod-us get events -n payments --sort-by=.lastTimestampYou see about thirty events, all from the last hour. The 2am window is gone: Kubernetes events have a default TTL of one hour, and the kube-apiserver garbage-collects them. By the time you ask, the answer has been deleted. A live API server is not a database - it tracks current state and lets the past evaporate, which is part of what makes it fast.
Your fallbacks are the usual three-you-have-one-of: audit logs (if enabled, shipped somewhere queryable, and retained), your metrics stack (which has the symptoms, rarely the cluster's narrative - "this Deployment rolled, that ConfigMap changed, that pod was OOMKilled"), and Argo's history (only for changes that came through Git).
What you need is a persistent timeline that subscribes to events and resource changes as they happen and keeps them past the TTL, queryable by time, namespace, and kind. Radar records exactly that - a unified timeline of Kubernetes events and resource changes you can scroll back to the minute something broke (persisted to SQLite when you want it to outlive a restart).
The real payoff is the question one step harder than "what changed." A pod restarted 17 times, twelve of them last Wednesday between 02:55 and 03:10. kubectl describe shows the latest termination reason; kubectl logs --previous gets you exactly one instance back, not twelve. The weekly pattern only exists in retained history. When we traced one of these for a team, the 3am Wednesday OOMKills turned out to be a CronJob in a different namespace whose memory spike was evicting the worker pods. Nobody spots that from live state - it was sitting in the timeline.
5. "What's quietly misconfigured before it pages me?"
Not "what is broken right now" - what is latent. The Deployment with no memory limit that gets OOMKilled under load. The container running as root. The Ingress with no TLS. The PDB that allows zero disruptions. None of these page you today; they page you on the worst day.
kubectl will show you each setting if you know to look:
kubectl get deploy -n payments -o json \
  | jq '.items[] | select(.spec.template.spec.containers[].resources.limits == null) | .metadata.name'
But that is one check, hand-written, for one antipattern, in one namespace. The real question - "scan everything here against the things experienced operators know to check, and tell me what is off" - is a judgment, and kubectl returns objects; it does not have an opinion about them.
What you need is a scanner that encodes those opinions. Radar ships a cluster audit - 31 checks across security, reliability, and efficiency, drawn from Polaris, Kubescape, Trivy, and the NSA/CISA hardening guidance - that runs instantly against its cache with nothing installed in the cluster, groups findings so you fix a class at a time, and respects Kubernetes inheritance so a check on a Deployment does not double-fire on its Pods.
What these questions have in common
Look at them together and the pattern is not "kubectl is missing a flag." It is that each question is about something other than one object's current YAML:
| Question | What kubectl returns | What the question is really about |
|---|---|---|
| What breaks if I change this? | One object's spec | Relationships - the graph |
| Is this pod isolated? | Policy YAML | Effective behavior + live traffic |
| What's inside this image? | A shell in a running container | The artifact itself |
| What changed last night? | Live state, 1h event TTL | History - the past |
| What's misconfigured? | Objects | Judgment over those objects |
kubectl is built to fetch one object, in one cluster, as it is right now, as text. That is the right primitive for an enormous amount of operational work. But comprehension - how things connect, how they behave, what is inside them, what they were, and whether they are sound - is not a fetch. It is the cluster rendered and assessed as the connected, living system it actually is. That is a different tool, sitting next to kubectl, not replacing it.
Where kubectl is still right
To be clear, none of this is an argument against kubectl. We use it constantly. "Is this pod running," "tail these logs," "scale this Deployment," "patch this ConfigMap to test something right now" - it is the right tool, and anything trying to be "the new kubectl" is solving the wrong problem. The framing is kubectl plus something that understands the graph, not kubectl versus anything.
The Radar take
Every one of those five is answered by Radar OSS - a single binary you launch with kubectl radar (or a desktop app), running locally against your kubeconfig with nothing installed in the cluster. Topology for the relationships, NetworkPolicy coverage and live traffic for isolation, the image filesystem viewer for what is inside, a persistent timeline for the past, and the cluster audit for posture. All of it within one cluster, for free.
The point where you need more is when the same five questions go fleet-wide. "Is this CVE image running anywhere across my fourteen clusters?" "What is actually different between the staging cluster and the prod cluster?" "Who can exec into a prod pod in any cluster?" Same questions, cross-cluster scope - and that is what Radar Cloud adds on top of the same engine: a fleet-wide image inventory, cross-cluster compare, and a fleet RBAC index.
We did not set out to replace kubectl. We set out to render the cluster as the graph it already is, so the questions kubectl was never shaped for stop being afternoon-long shell-script projects. If any of the five above sound familiar, that is the gap we are aiming at.
If you have already hit this wall, you are not the only one - we wrote about the broader fleet visibility gap for teams already past two clusters.
Keep reading
Radar MCP vs kubectl: A Kubernetes Agent Benchmark on 52 Faults
We benchmarked Radar's Kubernetes MCP server against raw kubectl on 52 live-cluster faults. Radar improved diagnosis quality and cut tool calls by 76%.
Introducing Radar Cloud: Multi-Cluster Kubernetes Visibility for Teams
Radar Cloud is the hosted team layer on top of Radar OSS: fleet views, SSO on every plan, K8s-native RBAC via impersonation. Cluster state never leaves.
We Build a Kubernetes Dashboard. AI Agents Might Make It Obsolete.
The honest bear case against our own product: if agents operate the cluster, who needs the UI? Here's what actually dies, and the job that gets bigger.