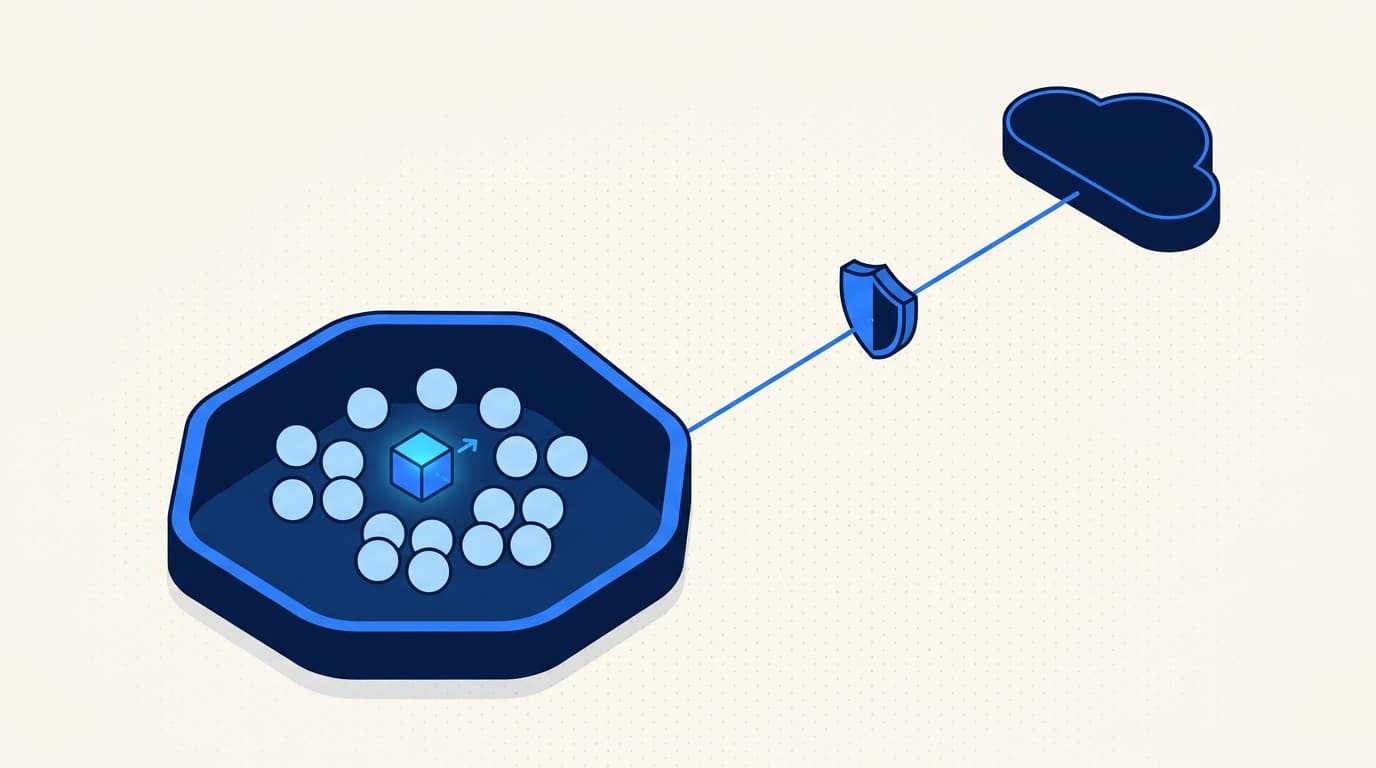
Radar's In-Cluster Architecture: Outbound-Only, Scoped, Live by Default
How Radar's in-cluster install works: outbound-only TLS, read-only RBAC by default, ~32MB RSS. The five questions every platform team asks, answered.
Every platform team we've talked to about Radar Cloud asks the same five questions before they'll install anything in their cluster:
- Does it need inbound network access?
- What Kubernetes permissions does it need?
- What data leaves the cluster?
- How are credentials handled?
- What's the blast radius if Radar gets compromised?
These are the right questions. If you're responsible for a cluster that handles real workloads, "just install our Helm chart and give it cluster-admin" is not an acceptable answer. The rest of this post is how we answer each one, with the actual design choices we made and the tradeoffs that came with them.
1. No inbound access. Ever.
The simplest question first. Radar never opens a port. Not a NodePort, not a LoadBalancer, not an Ingress. It doesn't sit behind a Service that your cluster exposes to the internet, and it doesn't need you to punch holes in your firewall for a vendor CIDR range.
We rejected the inbound model early. The typical pitch goes: "just expose our controller on an Ingress and we'll call it when we need to." For most platform teams we've worked with, that's a non-starter. Every inbound path is a new attack surface, a new TLS cert to manage, a new firewall rule to audit, and a new thing your security team has to sign off on. Doing that for a vendor tool is a lot of ceremony for visibility.
So Radar dials out. On startup, it opens a single TCP connection to api.radarhq.io:443, negotiates TLS, upgrades to a WebSocket, and authenticates with a cluster-scoped bearer token it got at install time. On top of that one WebSocket we run yamux for stream multiplexing, so every Cloud-initiated request (topology fetch, log tail, exec session, MCP tool call) opens a fresh stream on the same connection instead of a new TCP dial. That connection stays open for the lifetime of the pod.
What this looks like from your side:
- One egress rule: allow
api.radarhq.io:443(or the EU endpoint, depending on region). - No inbound rules. No public IPs. No load balancers.
- TLS on the wire. Radar verifies the server cert against public CAs; the server authenticates Radar by SHA-256-hashing the presented bearer token and comparing it against the hash it stored when the cluster was onboarded.
The honest concession: if you run a cluster with zero egress to the public internet, Radar requires you to allowlist one FQDN. That's the minimum. We can't do visibility-as-a-service without a network path. For air-gapped environments, the open-source Radar is the right answer.
2. Read-only by default. Read-write is opt-in per feature.
The Helm chart installs one Deployment running one container, with one ServiceAccount bound to one ClusterRole. The default ClusterRole is read-only.
apiVersion: rbac.authorization.k8s.io/v1
kind: ClusterRole
metadata:
  name: radar
rules:
  # Core resources
  - apiGroups: [""]
    resources:
      - pods
      - services
      - endpoints
      - configmaps
      - namespaces
      - nodes
      - persistentvolumes
      - persistentvolumeclaims
      - events
      - serviceaccounts
    verbs: [get, list, watch]

  # Workload controllers
  - apiGroups: ["apps"]
    resources: [deployments, statefulsets, daemonsets, replicasets]
    verbs: [get, list, watch]

  # Batch
  - apiGroups: ["batch"]
    resources: [jobs, cronjobs]
    verbs: [get, list, watch]

  # Networking
  - apiGroups: ["networking.k8s.io"]
    resources: [ingresses, networkpolicies]
    verbs: [get, list, watch]

  # Autoscaling
  - apiGroups: ["autoscaling"]
    resources: [horizontalpodautoscalers]
    verbs: [get, list, watch]

  # RBAC (metadata only)
  - apiGroups: ["rbac.authorization.k8s.io"]
    resources: [roles, rolebindings, clusterroles, clusterrolebindings]
    verbs: [get, list, watch]

  # Metrics (if metrics-server is installed)
  - apiGroups: ["metrics.k8s.io"]
    resources: [pods, nodes]
    verbs: [get, list]

  # CRDs - discovery only, so Radar can find Argo, Flux, Istio, etc.
  - apiGroups: ["apiextensions.k8s.io"]
    resources: [customresourcedefinitions]
    verbs: [get, list, watch]

  # Secrets - metadata only (names, types, timestamps), NOT values.
  - apiGroups: [""]
    resources: [secrets]
    verbs: [get, list, watch]
That's the baseline. It lets Radar watch resources, build the topology, correlate events, and show you Helm releases. It does not let it mutate anything, exec into pods, or read log content.
If you want specific features that need more, you opt in. Each feature maps to a named set of rules:
features.logs=trueaddspods/logget.features.exec=trueaddspods/execcreate. This is also gated per-user by Cloud RBAC, so Viewers never get a terminal.features.helm=trueadds get/list/watch/create/update/patch/delete on Helm-managed resources (scoped via labels).features.scale=trueadds update ondeployments/scale,statefulsets/scale.features.restart=trueadds patch on workloads.
You enable them in values.yaml. Nothing else flips on automatically.
3. The data contract
The question I always want asked and rarely get: what actually leaves the cluster, and when?
The short answer: cluster state isn't pushed. The control plane doesn't run an event ingest pipeline, doesn't keep a server-side replica of your resources, and doesn't store a "last known cluster snapshot" anywhere. When a browser asks Radar Cloud for a Pod, the Hub authenticates the user, opens a fresh stream over the existing WebSocket, and forwards the HTTP request through to the in-cluster Radar pod, which serves it live from its SharedInformer cache. The bytes go from cluster to browser via the Hub, on demand, and nothing in the middle is written to disk.
| Data that crosses the tunnel (on demand, in response to a user request) | Data that never crosses |
|---|---|
| The specific resources a user is currently looking at (with managedFields stripped) | Secret data values. Ever. |
| Filtered K8s events for the view the user has open | ConfigMap values annotated radarhq.io/redact: "true" |
| Helm release metadata when a user opens a Helm view | Logs, exec, port-forward at rest (all streamed; nothing persisted) |
| Topology relationships when a user opens topology | Raw kube-apiserver audit logs |
| Logs, exec, port-forward bytes (streamed live; closed when the tab closes) | Background telemetry - nothing ships you didn't ask for |
| MCP tool responses when an authorized AI client calls them | Anything that wasn't requested by an authenticated browser or PAT |
A few things worth being explicit about.
Secret values never leave. Radar lists Secrets so it can show you that a Secret named db-credentials exists and is mounted into a pod, but it does not read the data field. At the informer level, we strip the data before it enters the in-memory cache. If you "view" a Secret in the Radar UI, we show you the keys and type. We do not show the values.
Logs, exec, and port-forward are streamed, not stored. When a user in the UI asks to tail a pod's logs, the Hub opens a stream through the WebSocket to in-cluster Radar, Radar opens a streaming read against pods/log, and the bytes flow back to the user's browser through that same stream. Nothing is written to disk on our side. When the user closes the tab, the stream closes. Same pattern for kubectl exec and kubectl port-forward equivalents.
managedFields gets stripped. If you've ever looked at the raw JSON of a Kubernetes object, you know managedFields can be larger than the rest of the object combined. We strip it at informer callback time, before the object enters the in-cluster cache. That saves memory in-cluster and bytes on the wire when the resource flows out in response to a browser request.
ConfigMaps can opt out via annotation. If you have ConfigMaps with sensitive content (which you shouldn't, but people do), annotate them with radarhq.io/redact: "true" and Radar treats them like Secrets - metadata only, values redacted at the boundary.
The control plane stores its own state, separately. Org membership, roles, cluster registry metadata, audit log, PAT hashes, billing state, and a small set of hub-native event kinds (cluster.disconnected, member invitations, billing). That's what's in the control plane's database. Your cluster's resources aren't.
4. Credentials: cluster bearer tokens over TLS
Each cluster connection is bootstrapped with a bearer token issued from the Radar dashboard by an Owner. The raw token is shown exactly once at creation and only ever stored as a SHA-256 hash server-side, bound to one cluster record.
On every connection, Radar presents the token over TLS; the Radar Cloud server hashes the presented value and compares it against the stored hash before opening the tunnel. There's no separate enrollment handshake and no client-cert material to manage in-cluster: the token itself is the long-lived credential. An Owner can rotate the token at any time from the dashboard, which invalidates the previous hash and forces Radar to reconnect with the new value.
We don't handle your kubeconfig, your cloud credentials, or your cluster CA. Radar authenticates to the Kubernetes API using the projected ServiceAccount token that the kubelet gives it, same as any in-cluster controller.
5. Blast radius: what happens if Radar is compromised
The worst case: someone gets code execution inside the Radar pod. What can they do?
With the default read-only ClusterRole, they can read cluster state. That's a disclosure problem, not a destruction problem. They cannot scale workloads to zero, they cannot delete your PVCs, they cannot exec into pods and pivot. The ClusterRole is the ceiling.
With read-write features enabled, the ceiling rises to exactly what those features allow. If you enabled features.scale=true, an attacker can scale deployments. If you enabled features.exec=true, they can open a shell in any pod - the same pod an Admin user could exec into through the UI. This is why we make every read-write feature opt-in and surface the RBAC impact in the Helm chart's NOTES.txt when you install it.
The other containment: Radar runs in its own namespace (radar by default), with a PodSecurityContext that drops all capabilities, runs as non-root, has a read-only root filesystem, and disables privilege escalation. A compromised Radar container can't write to disk or escalate to root without breaking out of the kernel's sandbox.
Why SharedInformer
In-cluster Radar uses the same client-go SharedInformer pattern as Radar OSS. A SharedInformer does one list call against the API server for a given resource kind, switches to a Watch stream for deltas, and maintains an in-memory cache that multiple consumers can read from.
Why this matters:
- Low API server load. One watch per kind, not N polls per second. On a cluster with 10,000 resources, we do 10k list reads at startup, then we're on watch streams. The kube-apiserver barely notices us.
- Deltas, not snapshots. When a pod transitions from Pending to Running, we ship one delta. Not the entire pod object repeatedly.
- Memory efficiency. On a cluster with a few hundred resources, Radar sits at ~32MB RSS. Memory grows roughly linearly with object count - a cluster with tens of thousands of pods will use more, but the constant factor is small because we strip
managedFieldsand denormalize aggressively.
The wire protocol
The uplink is a WebSocket over TLS, with yamux as the multiplexer on top. A few properties worth calling out:
- One connection, many streams. Every Cloud-initiated request (a browser loading topology, an MCP tool fetching resources, a log tail, a pod-exec session) is a fresh yamux stream on the same WebSocket. Streams are cheap (roughly 1KB of bookkeeping each); TCP dials are not.
- Plain HTTP inside. Each stream carries a normal HTTP request to the in-cluster Radar binary's HTTP router, including SSE for live updates and WebSocket upgrades for
kubectl exec. There's no custom binary protocol to reverse-engineer;helm templatethe chart and read the manifests if you want to audit the surface area. - Keepalives. yamux sends lightweight pings on idle connections so NATs and load balancers don't silently reap the tunnel, and so dead ends are detected quickly on both sides.
- Back-pressure. yamux's per-stream flow control keeps one slow consumer (say, a user tailing noisy logs) from starving every other stream on the same connection.
Failure modes
Networks fail. Our backend sometimes has outages. Here's what Radar does when things go wrong.
Uplink drops. Radar reconnects with exponential backoff (1s, 2s, 4s, ..., capped at 60s). While disconnected, it keeps its informer caches warm so the moment the WebSocket reopens it can serve fresh requests immediately - there's no "rehydrate from a checkpoint" step because the cluster's API server is the source of truth and Radar's informers are already tracking it. The Hub fires a cluster.disconnected notification when the WebSocket drops past a grace period and cluster.reconnected when it comes back.
Radar Cloud has an outage. Your cluster keeps running. Radar is not in the data path for your workloads. It doesn't mutate anything, it doesn't proxy traffic, it doesn't gate admission. If we're down, you lose visibility in the Radar UI for the duration. That's the worst thing that happens.
Radar crashes. Kubernetes restarts it. On startup, it redials the tunnel with the bearer token from its Helm values, rebuilds its informer caches, and is back in the fleet view. Cold start to steady state is usually under 10 seconds on a small cluster, maybe 30 seconds on a big one. If you enabled SQLite-backed timeline persistence with a PVC, in-cluster event history survives across restarts.
What we don't do
This is the part I care about most, because a lot of in-cluster tools in this space have grown tentacles.
- No sidecar injection. We don't mutate your pods.
- No mutating admission webhooks. We don't sit in the admission path. If Radar is down, your deploys still work.
- No validating webhooks. Same reason.
- No CRDs of our own. We read your CRDs (Argo, Flux, Istio, your own). We don't install ours.
- No init containers. Nothing piggybacks on your workloads.
- No cert-manager dependency. Radar authenticates with a static bearer token you supply at install time. Nothing in the chart asks your cluster to issue certs for us.
One Deployment. One ServiceAccount. One ClusterRole. One Secret. One namespace. That's it.
Install
helm repo add skyhook https://skyhook-io.github.io/helm-charts
helm repo update

helm install radar skyhook/radar -n radar --create-namespace \
  --set cloud.token=$RADAR_CLOUD_TOKEN
The token comes from the Radar dashboard when you click "Add cluster." By the time helm install exits, Radar is connected and your cluster shows up in the fleet view.
If you want to audit exactly what lands in your cluster before installing, helm template the chart and read the manifests. There are no surprises. That's the whole point.
The short version
In-cluster Radar is a small Go binary that dials out to one FQDN over TLS, authenticates with a cluster-scoped bearer token, runs with a read-only ClusterRole unless you opt into more, serves on-demand requests reverse-proxied from the Radar Cloud control plane over a yamux-multiplexed WebSocket, and never stores logs or exec sessions at rest. The control plane doesn't cache cluster state - everything you see in the dashboard is served live from the in-cluster pod. It's ~32MB RSS at steady state on a typical cluster. If it gets compromised, the ClusterRole is the ceiling on what an attacker can do.
None of this is revolutionary. It's just the default every hosted Kubernetes tool should have been shipping for the last five years. Some do. Many don't. If you're evaluating one, these are the five questions to ask - ours or anyone else's.
Keep reading
Why Radar Cloud Doesn't Cache Your Cluster State
Most multi-cluster dashboards copy your cluster state into a backend cache. Radar Cloud doesn't. Here's why the reverse-proxy model is the right call.
Cluster Audit: The 31 Checks That Catch What You Forgot
Most clusters fail the same checks. Radar's built-in audit runs 31 of them inline against your live state. Inspired by Polaris and the NSA / CISA hardening guide.
Introducing Radar Cloud: Multi-Cluster Kubernetes Visibility for Teams
Radar Cloud is the hosted team layer on top of Radar OSS: fleet views, SSO on every plan, K8s-native RBAC via impersonation. Cluster state never leaves.