Cluster Audit: The 31 Checks That Catch What You Forgot
Most clusters fail the same checks. Radar's built-in audit runs 31 of them inline against your live state. Inspired by Polaris and the NSA / CISA hardening guide.
Every cluster I've ever audited has the same handful of issues. Pods running as root. Containers without resource limits. A service account that's bound to cluster-admin because someone needed it for "just one thing" eight months ago. A latest tag in a Deployment that hasn't been updated since.
Each issue is small. The aggregate is the entire reason the security team is nervous about Kubernetes.
Radar ships with a built-in cluster audit that runs 31 of these checks against your live state and surfaces failures inline on each affected resource. No CRDs to install, no separate controller to operate, no Polaris-style YAML pipeline to maintain. It's part of the Radar binary.
What "best practice" actually means here
Let's be specific about the source. The check set is inspired by Polaris and the NSA / CISA Kubernetes hardening guide. Both are good prior art - Polaris because it's the de-facto rule set for Kubernetes config validation, NSA / CISA because it's the standard most security teams point at when they want to argue for stricter defaults.
The result is opinionated but defensible. Every check has a reason. We don't flag YAML style preferences ("use camelCase in your annotations"). We flag things that have an actual blast radius if they go wrong.
The 31 checks split into three categories.
Security (the ones the security team will ask about)
- Containers running as root.
- Privileged containers.
allowPrivilegeEscalation: true.- Writable root filesystems.
- Dangerous or insecure Linux capabilities.
- Host network, PID, or IPC namespaces.
- Container runtime socket mounts.
- Sensitive host path mounts.
- Secrets accidentally placed in ConfigMaps.
- Auto-mounted service account tokens.
Reliability (the ones the SRE team will ask about)
- Missing readiness or liveness probes.
- Mutable image tags (e.g.
latest). - Pull policy mismatches on digest-pinned images.
- Single-replica Deployments or StatefulSets.
- Missing PodDisruptionBudgets on replicated workloads.
- Missing topology spread constraints.
- All replicas scheduled on one node.
- Services with no matching pods.
- Ingresses pointing at missing Services.
- Deprecated API versions.
Efficiency (the ones the FinOps team will ask about)
- Missing CPU or memory requests.
- Missing CPU or memory limits.
- Resource utilization far below or above requests.
- Unused ConfigMaps or Secrets.
The checks carry framework labels where they map cleanly to NSA / CISA or CIS guidance. The goal is not to replace a full compliance program. It is to make the obvious misses visible before they become incident or audit material.
How findings show up
The audit runs continuously. There's no "run scan" button - findings update as your resources change.
The Cluster audit sidebar entry has three views:
- Summary - findings broken down by category and severity.
- By resource - rows of resources sorted by issue count. Useful for "fix the worst offenders first."
- By check - rows of checks sorted by frequency. Useful for "we're going to standardize on
runAsNonRootacross the fleet, what does that touch?"
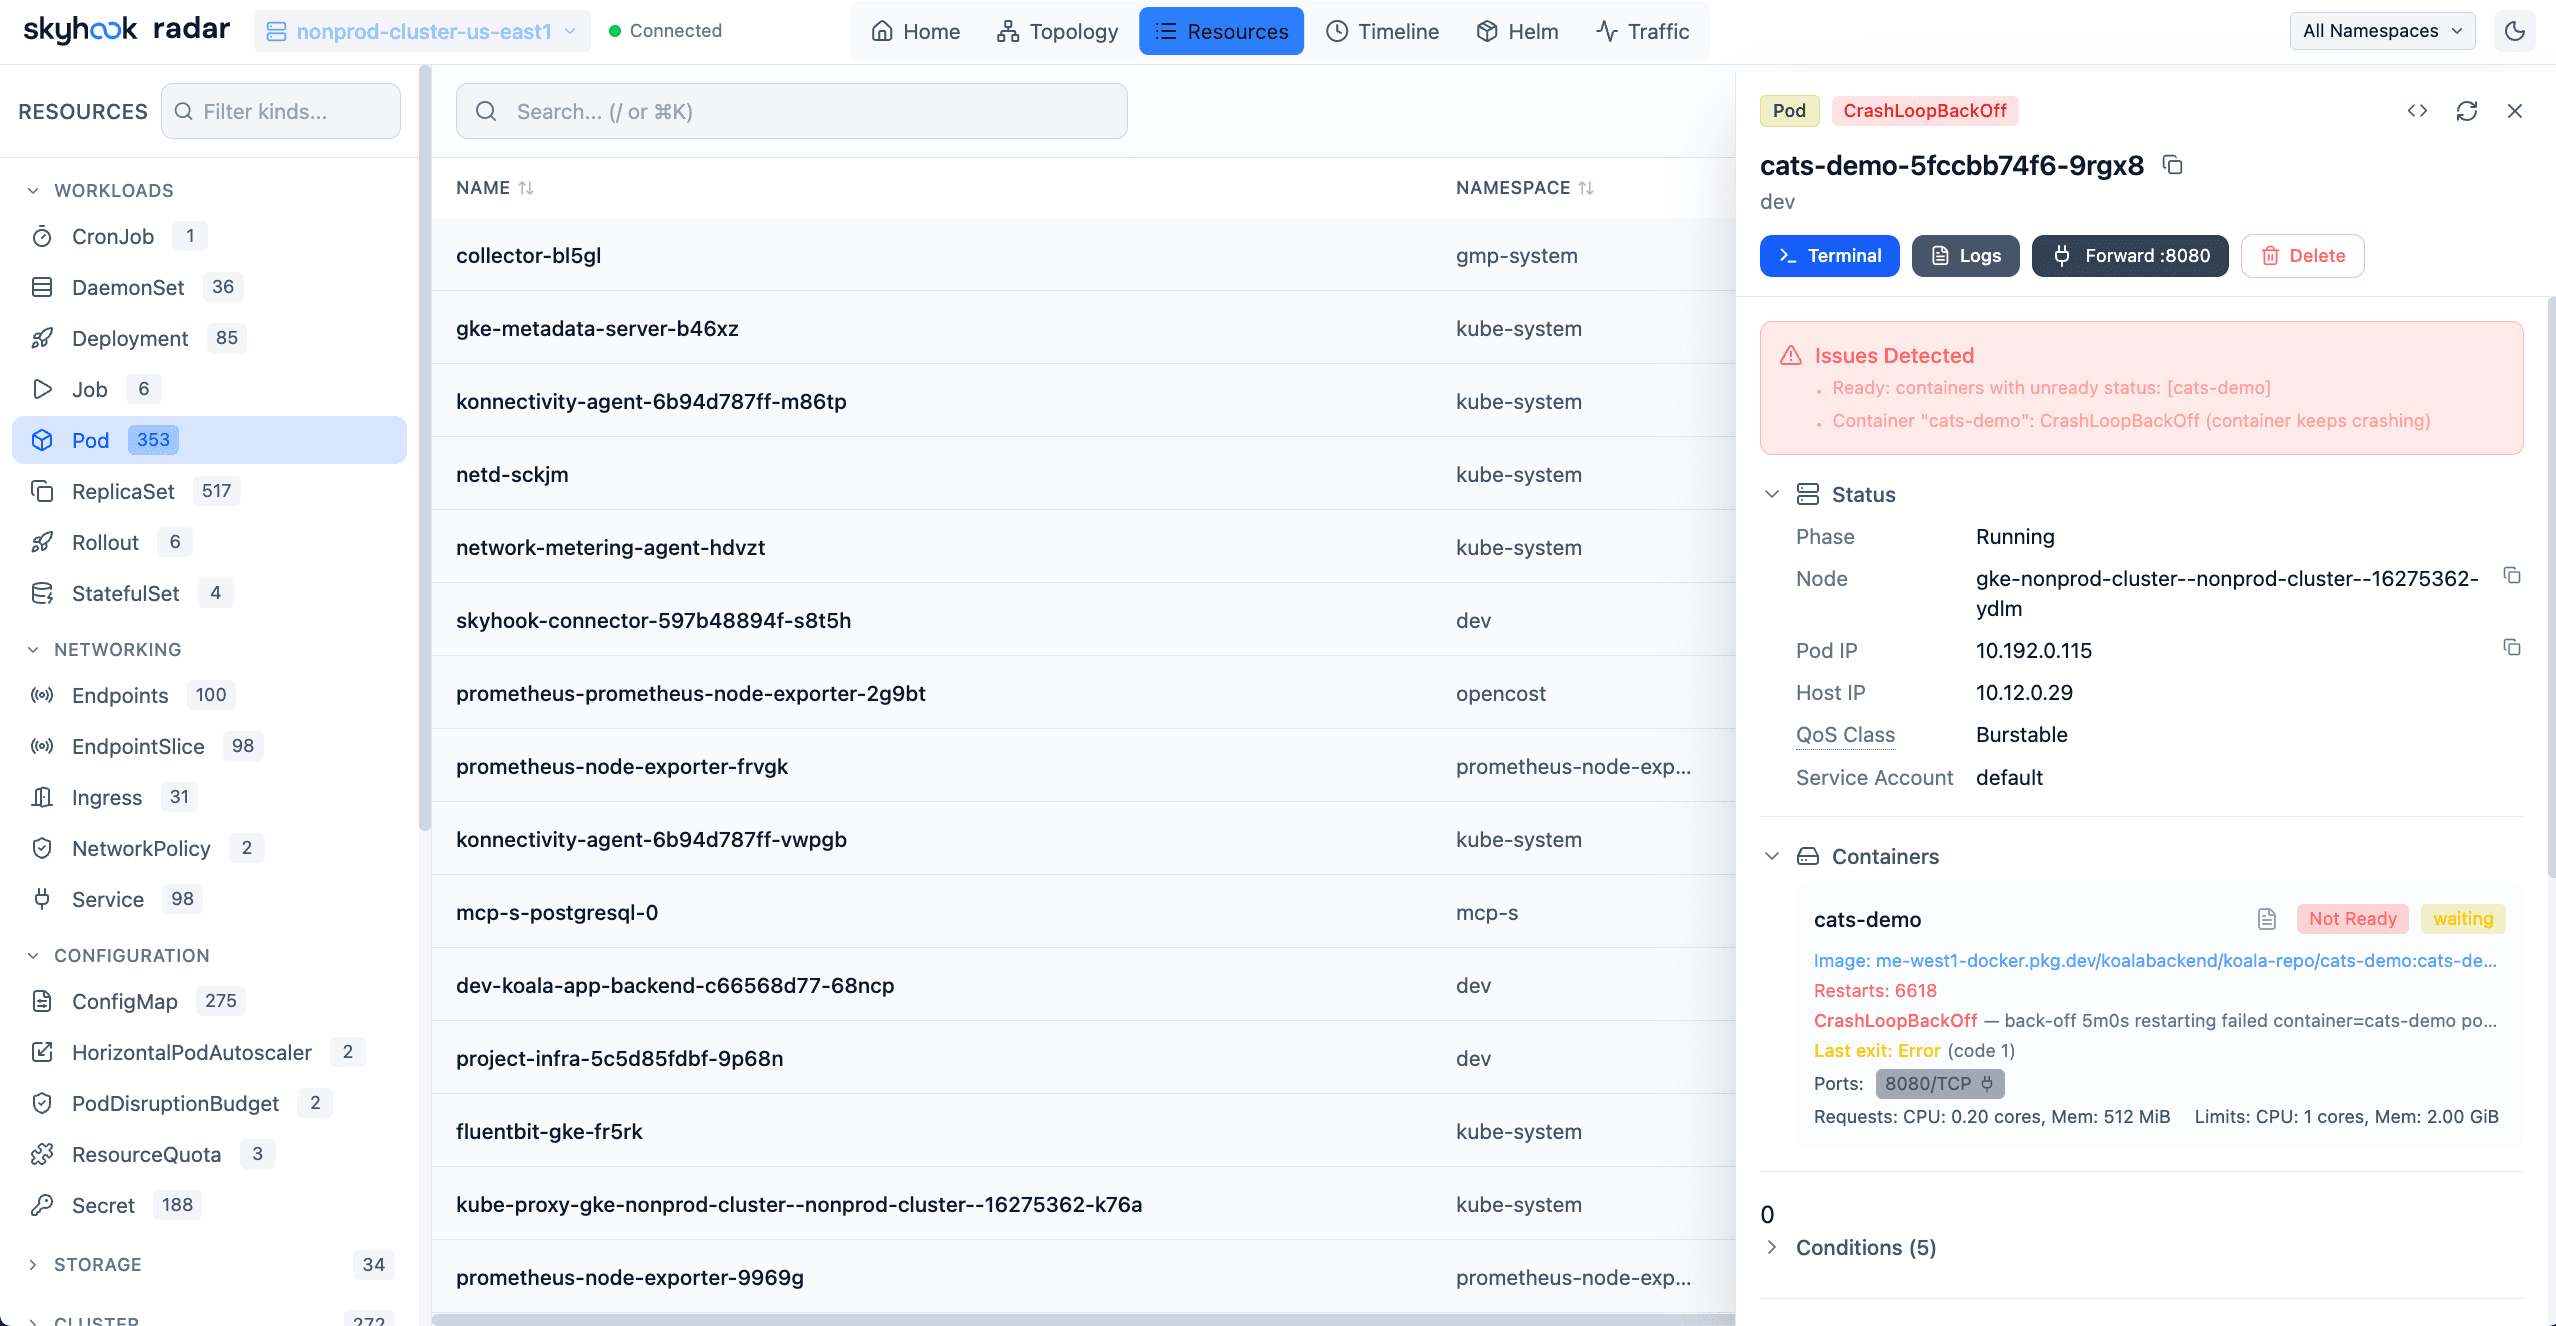
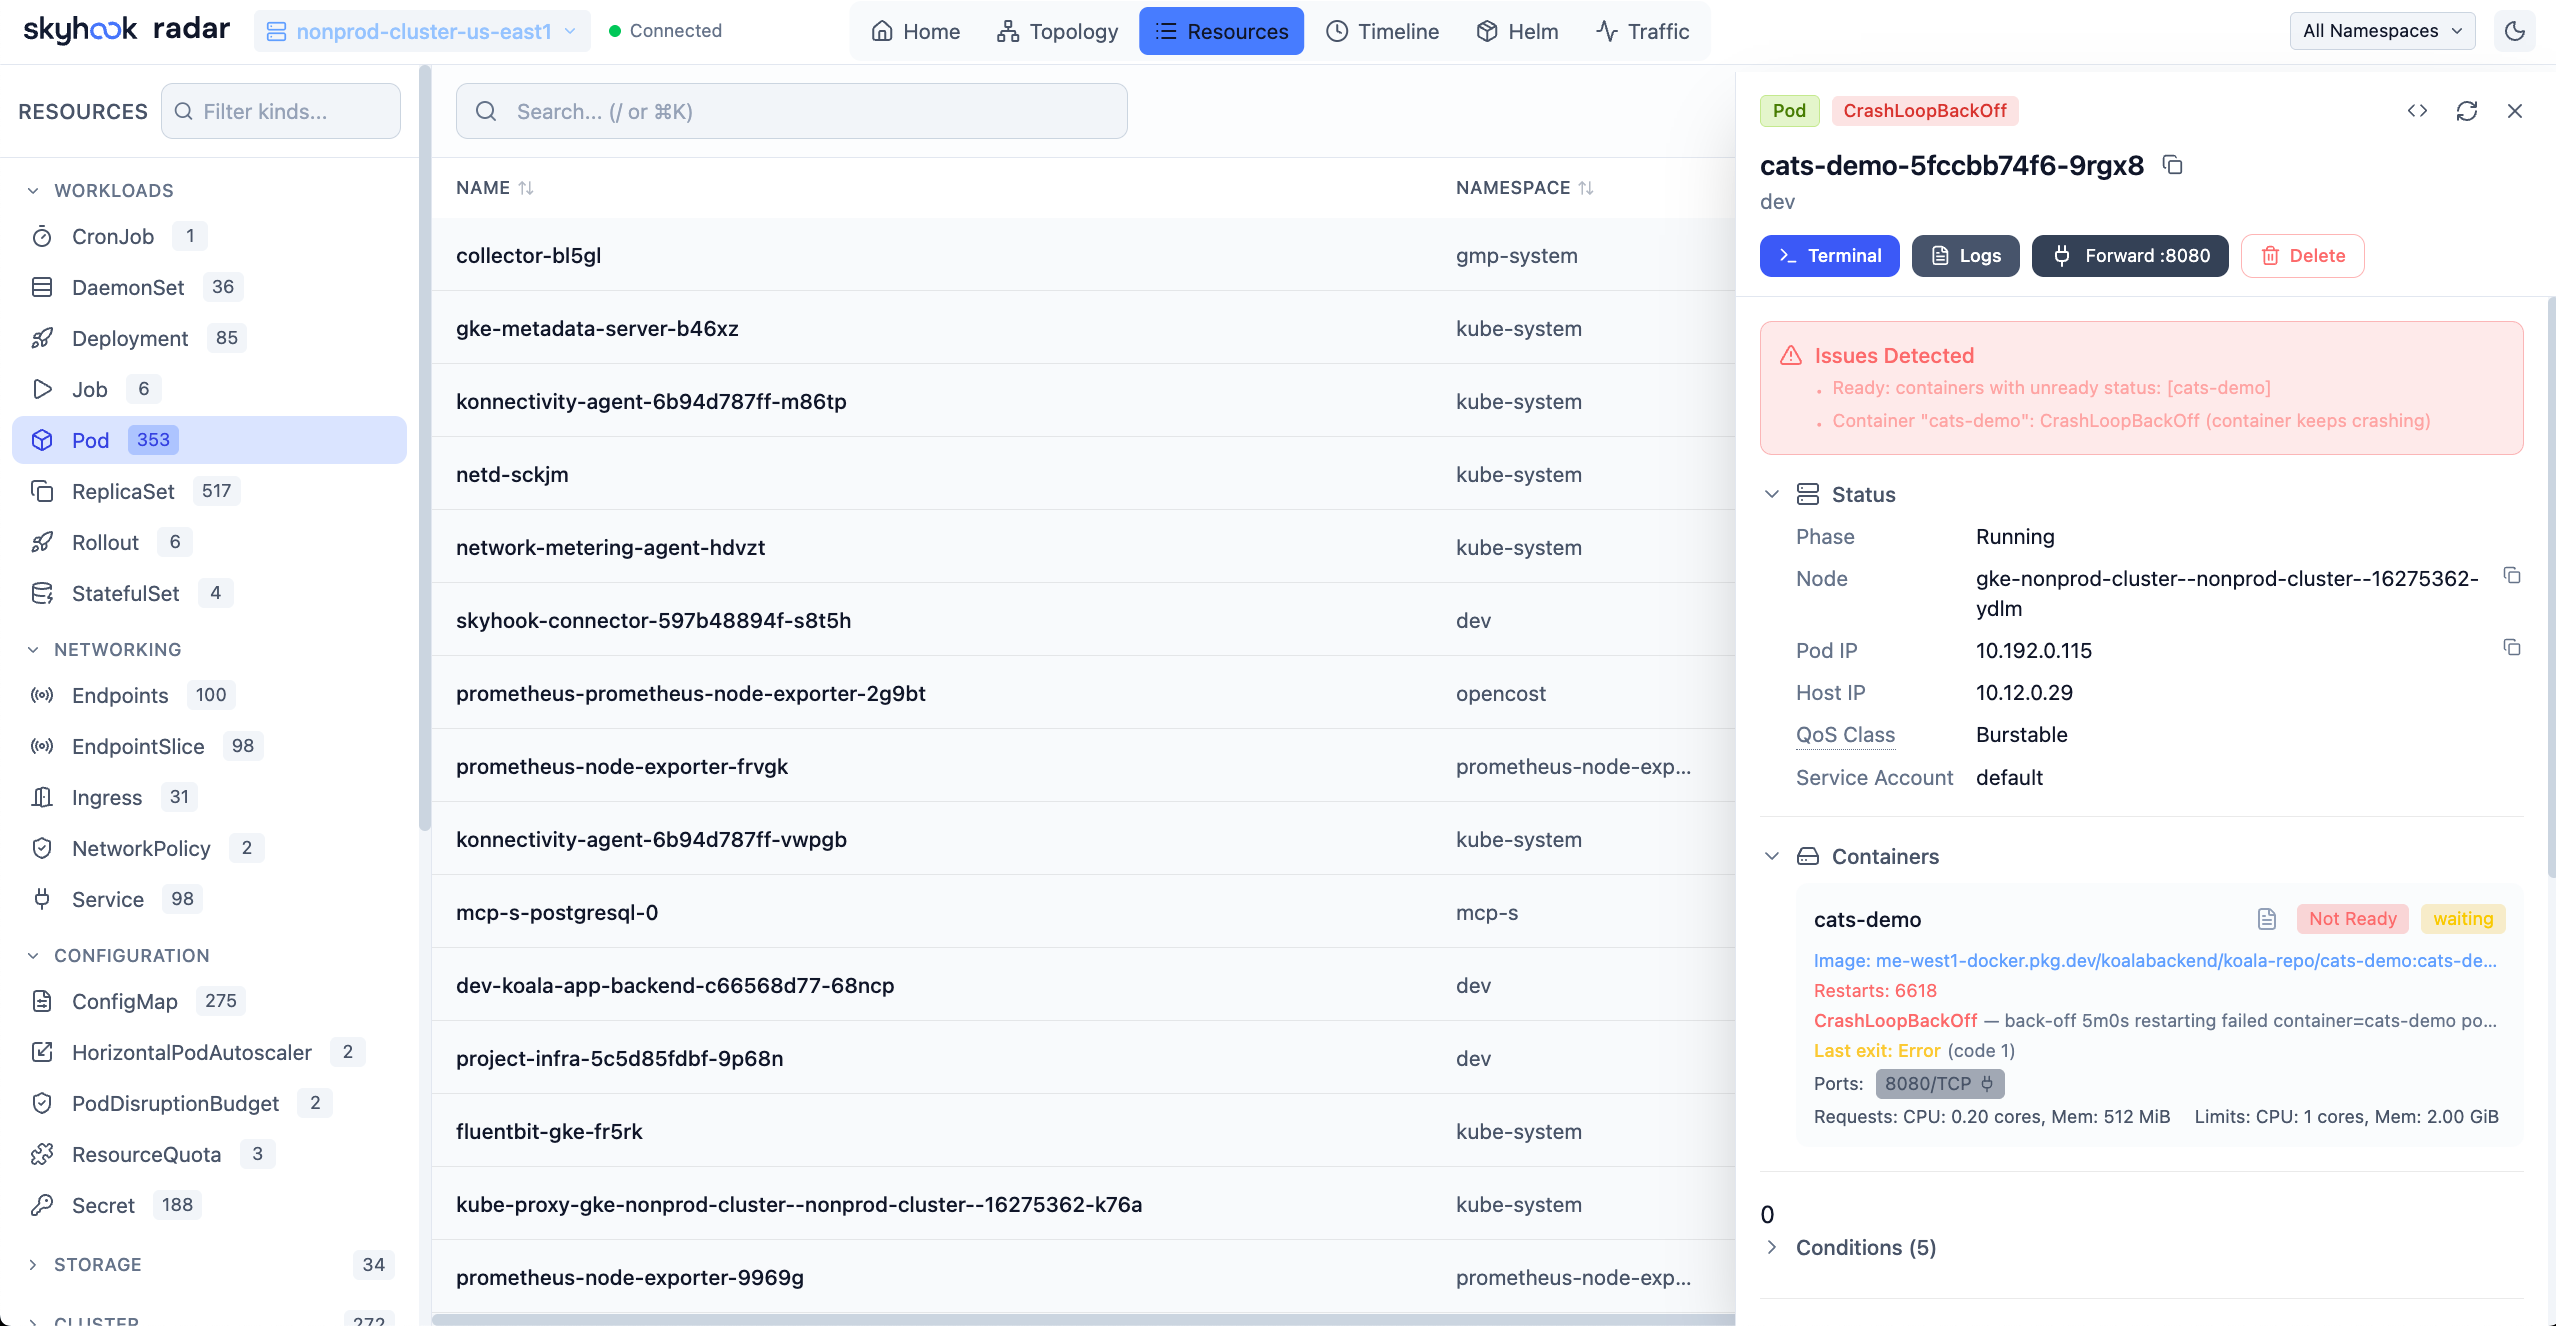
In the resource browser, every row that has an audit finding shows a small chip. Click in, the Audit tab shows the per-resource breakdown with the rule, the severity, and a remediation snippet.
The useful moment is usually not "run a scanner once a quarter." It is "I'm already looking at this Deployment, and Radar tells me it has no readiness probe, one replica, and no PDB."
Ignoring noise without disabling the check
The first thing teams want to do after enabling a check set is silence the things that are correct-but-flagged. Polaris-style global disables work but lose the signal everywhere - usually you only want to suppress for a specific namespace or workload.
Ignore patterns are configured in the Radar values:
audit:
  ignore:
    # exact resource match
    - kind: DaemonSet
      namespace: kube-system
      name: cilium
      checks: [host_network, privileged]
    # selector match
    - namespaceLabels:
        environment: dev
      checks: [latest_tag, missing_resource_limits]
Selectors compose. The pattern most teams land on: a "production has strict rules, dev is intentionally lenient" carve-out, plus a small allow-list for system DaemonSets that legitimately need elevated access (Cilium, kube-proxy, the storage CSI driver, etc.).
For local Radar, the same shape lives in ~/.radar/audit-ignore.json. Both formats round-trip; you can edit either.
Ignores are configuration, not deletion: the check still exists, but the UI stops treating that known exception as work.
Programmatic access
Two surfaces beyond the UI.
The HTTP API:
GET /api/audit                                    # whole cluster
GET /api/audit/resource/{kind}/{namespace}/{name} # single resource
JSON output, filterable by category and severity. Useful for wiring findings into CI - a PR that introduces a new high-severity finding should fail before it lands in main, and curl /api/audit | jq '.findings | map(select(.severity == "high"))' is the easy way to ask.
The MCP tool audit_findings is the same surface, packaged for AI tools. Filterable by category, severity, namespace. The use case we hear most is "ask Claude to explain this finding" or "have the AI propose a remediation patch and then dry-run-apply it."
Cloud rolls it up across the fleet
In Radar Cloud, fleet checks fan out to connected clusters and merge the results.
That answers different questions:
- Which clusters have critical audit findings right now?
- Which check is failing across the most clusters?
- Did our policy change land everywhere?
- Which namespace owns most of the remaining hygiene debt?
The data still comes from the in-cluster Radar instances. Cloud is the coordination layer, not a hosted copy of every finding forever.
What it isn't
Worth being explicit.
Not a runtime security tool. Cluster audit catches misconfiguration. It doesn't replace Falco, Tetragon, or whatever your eBPF-based runtime detection layer is. A privileged container that gets compromised at runtime is its problem; a privileged container that shouldn't have been deployed in the first place is ours.
Not a CIS benchmark scanner. kube-bench and Trivy do CIS benchmarks against the cluster control plane (etcd, kube-apiserver, kubelet config). Cluster audit runs against the workloads running on the cluster. Both are useful; they don't overlap.
Not deterministic across check versions. We add checks as patterns emerge in the wild. A new high-severity check shipping in a Radar release will surface findings that didn't exist before. The mitigation is the ignore-pattern config above and the changelog, which calls out new and changed checks per release.
Why bake it in instead of pointing at Polaris
We considered shipping Radar as "use Polaris and we'll render its output." Two reasons we didn't.
The first is the install cost. Polaris is good, but it's another Helm chart to deploy, another CRD set to track, and another upgrade cycle. For a tool that's supposed to give you visibility in five minutes, asking you to also deploy a separate audit controller is the wrong answer.
The second is integration. The audit findings show up next to the resource that has them, in the same UI you're already using to debug. The MCP integration lets an AI tool fetch findings the same way it fetches resources. The Cloud fleet view aggregates findings across clusters because it already aggregates everything else. Bolting Polaris's output onto our UI would have been a constant integration tax; building the check engine in-process is one decision we make once.
The shape of it
Most clusters fail the same handful of checks. Most of those failures have boring fixes. The reason they don't get fixed is that nobody surfaces them in the same place where the engineers actually work.
Cluster audit is the same idea as the rest of Radar - put the information where you'd already be looking, don't make people deploy another thing to get it. The 31 checks aren't novel. The fact that you can see them inline next to the broken resource, with an MCP endpoint for your AI tools and a fleet rollup in Cloud, mostly is.
If you want to see what your cluster looks like under it, the open-source Radar is free for self-hosted and the audit is on by default - install instructions are at radarhq.io/docs.
Keep reading
Why Radar Cloud Doesn't Cache Your Cluster State
Most multi-cluster dashboards copy your cluster state into a backend cache. Radar Cloud doesn't. Here's why the reverse-proxy model is the right call.
MCP for Kubernetes: Live Cluster Context for AI Tools
Pointing an AI at raw kubectl works, badly. Radar's built-in MCP server gives Claude, Cursor, and friends a token-optimized, RBAC-aware view of your cluster.
Radar's In-Cluster Architecture: Outbound-Only, Scoped, Live by Default
How Radar's in-cluster install works: outbound-only TLS, read-only RBAC by default, ~32MB RSS. The five questions every platform team asks, answered.