Why Radar Cloud Doesn't Cache Your Cluster State
Most multi-cluster dashboards copy your cluster state into a backend cache. Radar Cloud doesn't. Here's why the reverse-proxy model is the right call.
The default architecture for a multi-cluster Kubernetes dashboard is: agent in every cluster, agents push state to a backend, backend stores a replica per cluster, UI reads from the backend.
That's the shape of most products in this category. We picked the opposite shape.
The rule
Radar Cloud does not maintain a hosted copy of your Kubernetes resource state.
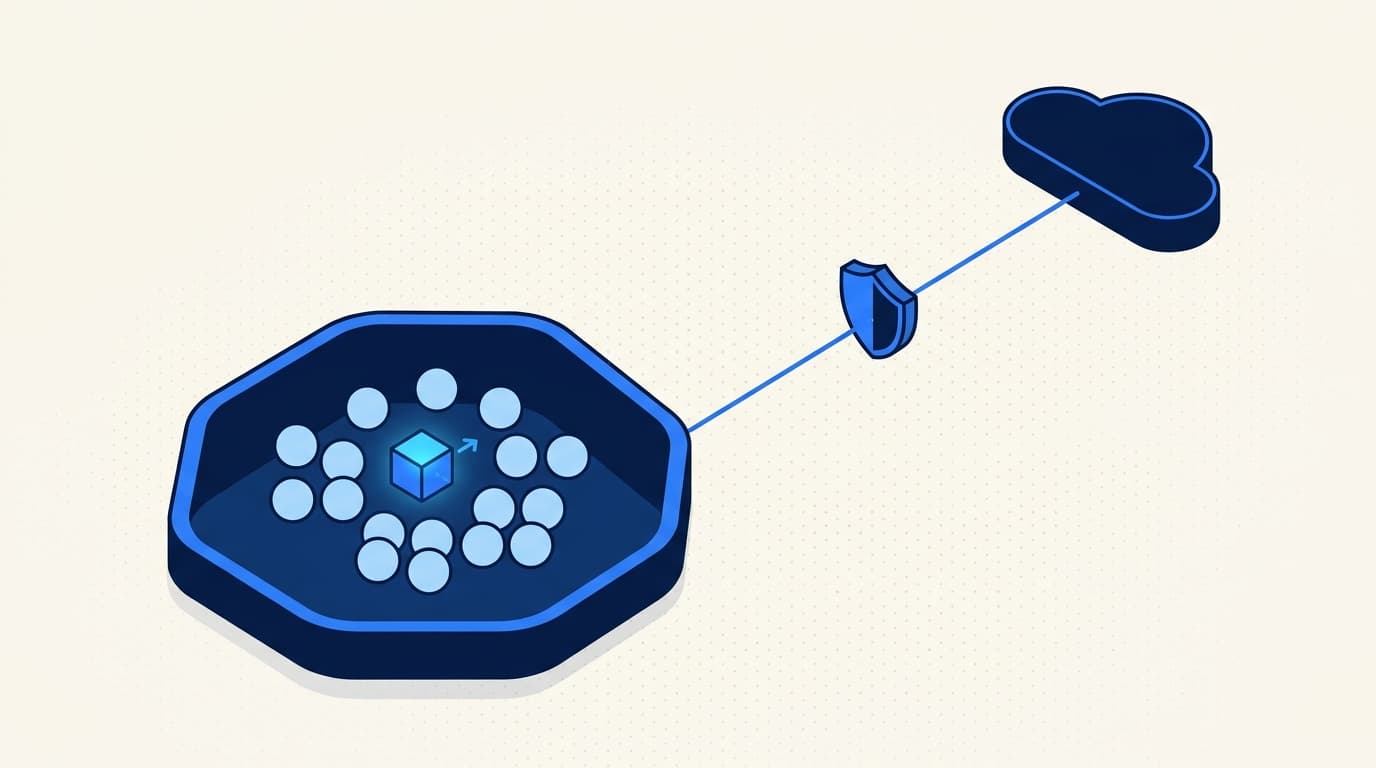
The Radar binary runs in each connected cluster. When you open a cluster in the Cloud UI, the browser talks to the Radar Cloud control plane, the control plane authenticates you, and the request is reverse-proxied over that cluster's existing outbound WebSocket to the in-cluster Radar pod.
The in-cluster Radar answers from the same live engine the OSS binary uses: informers, topology builders, timeline storage, Helm readers, GitOps integrations, audit checks, and MCP handlers.
Cloud owns the team layer. The cluster owns the cluster data.

The shape of the connection
In-cluster Radar opens one outbound TCP connection to api.radarhq.io:443, negotiates TLS, upgrades to a WebSocket, authenticates with a cluster-scoped bearer token, and runs yamux for stream multiplexing on top.
When a browser asks Radar Cloud for "Pods in namespace prod":
- The control plane authenticates the user against the org and cluster.
- It strips inbound
X-Forwarded-*headers (anti-spoof). - Injects
X-Forwarded-UserandX-Forwarded-Groups: cloud:<role>,cloud:user:<user_id>,.... - Opens a fresh yamux stream over the existing WebSocket.
- Forwards the HTTP request through that stream to the in-cluster Radar pod.
- The pod runs the request against its local SharedInformer cache, with the user impersonated on the K8s API.
- The response flows back through the same stream.
Logs, exec sessions, MCP tool calls, port-forwards - all the same machinery. Different streams, same WebSocket. Nothing is written to disk on the control plane side. Nothing is mirrored into a database for "fast queries later." Live K8s state is the answer; the control plane just brokers access to it.
What lives in Cloud, what stays in the cluster
The control plane does have a database. It stores things that genuinely belong on the SaaS side.
| Cloud data | Cluster data |
|---|---|
| Users, orgs, members, roles, invitations | Resources and CRDs |
| Cluster registry metadata (id, name, env, labels, status) | Topology and traffic views |
| Cluster token hashes | Kubernetes events and the Radar timeline |
| Billing and subscription state | Helm releases and GitOps state |
| Org-scoped audit log | Logs, exec sessions, port-forward streams |
| Personal access tokens, notification preferences | Cluster audit findings |
| Slack and webhook destinations | MCP tool responses |
When Cloud needs anything in the right column, it asks the connected Radar pod. The pod reads the cluster and responds over the tunnel.
Disconnected cluster? The Cloud UI shows it as not reporting. We do not serve a stale hosted snapshot and pretend it is fresh.
Why we picked this shape
Three reasons, in decreasing order of importance.
Live state is more correct than cached state
A backend that mirrors your cluster is always racing the source of truth. Radar (the in-cluster pod) already maintains a SharedInformer cache fed by the K8s Watch API - that's the right tier to cache at. Mirroring it again on the SaaS side gives you a copy that's always 200ms (or 5s, or 30s) older than the cluster's own cache. Most of the time you don't notice. The times you do notice are during incidents, when a stale view actively misleads you.
We'd rather pay the millisecond round-trip through the WebSocket and serve you what the API server believes right now.
The blast radius if we're compromised is bounded
The control plane never holds your cluster contents. If someone gets into our backend, they get: org metadata, audit history, billing records. They don't get a database-shaped snapshot of every customer's pods, ConfigMaps, and resource state.
The auth boundary is also clean. The cluster-scoped bearer token validates the WebSocket once at handshake time. Per-request, the control plane injects user identity into the request headers, but the K8s API decides what's allowed - we don't have a parallel permission system that could leak access. A compromised control plane can't exceed what the cluster's own RBAC permits, because every read and write goes through K8s impersonation.
Multi-tenant cost is sane
If we held a server-side replica per connected cluster, our backend cost would scale with the cumulative object count across the entire fleet. A handful of customers with chatty CRDs (or accidental ConfigMap regeneration loops) would dominate our hosting bill, and we'd end up either rate-limiting noisy clusters or eating the cost.
Reverse-proxy cost scales with active browser sessions, not with cluster size. A 5,000-pod cluster sitting idle costs us roughly the same as an empty one. That's why we can charge per-cluster instead of per-node or per-event - our cost model and yours line up.
What we give up
This isn't free. There are real tradeoffs.
The dashboard depends on the in-cluster pod being reachable. If the WebSocket drops, the cluster card goes "disconnected" in the UI and you can't drill into it until the pod reconnects. We send a notification when this happens (cluster.disconnected). For a hosted dashboard built on a server-side cache, you'd at least see stale data; with us, you see nothing for that cluster until it's back.
This is a tradeoff we accepted because (a) Radar reconnects with exponential backoff and the typical disconnect is brief, and (b) "stale data that looks fine" is actively dangerous during an incident. Honest unavailability beats deceptive freshness.
Some queries that would be cheap against a server-side cache aren't free here. "Show me everything across the fleet that's failing" goes wide-fan-out: the Hub opens a stream to each connected cluster, each pod answers from its local cache, the Hub aggregates. That works fine for tens of clusters and is sub-second; for a hundred or more clusters, the initial fleet-view load takes a few seconds with progressive rendering. It's slower than a pre-aggregated dashboard would be. We'd rather be a few seconds slower and tell you the truth.
Cross-cluster topology and cross-cluster timeline don't exist yet. The architecture doesn't preclude them - the data is reachable through the same multiplex - but they're meaningful product surface to build, and we've explicitly listed them under "what's NOT here today" in the docs. They're on the roadmap. We're not pretending they ship.
Where the persistent timeline lives
In-cluster Radar can persist its event timeline to SQLite at ~/.radar/timeline.db, backed by a soft retention budget set with --history-limit. With SQLite and a PVC, events survive pod restarts and can give you a multi-day local history. That's where event history "outlives the process restart" actually happens - in the cluster, not in our backend.
If you need longer or organization-wide timeline retention than that, the right answer today is to ship events to a SIEM or your existing log / event backend. We're not going to be a system of record for cluster events. We're a UI plane that gives you the right view of the live thing.
What this does not mean
It does not mean Cloud has no audit log.
Cloud keeps an org-scoped activity log for Cloud actions: cluster registration, token rotation, member changes, invitations, SSO setup, PAT lifecycle, billing changes, and sign-ins. That audit log is stored in Postgres with plan-based retention.
It does mean Cloud audit logs are not Kubernetes audit logs. If someone scales a Deployment inside a cluster, Kubernetes remains the system of record for that API call. Radar Cloud records the Cloud-side action boundaries; the apiserver records in-cluster impersonated operations if you have Kubernetes audit logging enabled.
The short version
The boring pitch for this architecture is: the K8s API server is the source of truth, the in-cluster Radar pod is the cache that's already correct, and the control plane's job is to authenticate humans and route their requests. Adding a third copy on the SaaS side would either be wrong (stale) or expensive (kept fresh at scale) or both.
If you're evaluating Radar Cloud against tools that ship a server-side replica, the questions worth asking are: how stale can the replica get during an incident, what happens to my data if the vendor is breached, and whose budget pays when one of the clusters gets noisy? Those answers are why we picked the shape we did.
Keep reading
Radar's In-Cluster Architecture: Outbound-Only, Scoped, Live by Default
How Radar's in-cluster install works: outbound-only TLS, read-only RBAC by default, ~32MB RSS. The five questions every platform team asks, answered.
Introducing Radar Cloud: Multi-Cluster Kubernetes Visibility for Teams
Radar Cloud is the hosted team layer on top of Radar OSS: fleet views, SSO on every plan, K8s-native RBAC via impersonation. Cluster state never leaves.
The Fleet Visibility Gap: Why Teams With 5+ Clusters Hit a Wall
Every tool that worked at 2 clusters breaks at 8. kubectl, Lens, k9s, Headlamp are all single-cluster-at-a-time. Here's where the wall is and what it looks like.