Introducing Radar Cloud: Multi-Cluster Kubernetes Visibility for Teams
Radar Cloud is the hosted team layer on top of Radar OSS: fleet views, SSO on every plan, K8s-native RBAC via impersonation. Cluster state never leaves.
A platform engineer we talk to runs staging, two prod regions, and a handful of ephemeral preview clusters. She loves Radar OSS - she has it aliased to r on her laptop and uses it every day. But when her on-call teammate pings her in Slack at 1am asking "what does the topology look like right now in prod-us?", she has to either screenshot her own view or walk him through kubectl for the next twenty minutes.
The OSS tool works exactly as designed. One engineer, one cluster, one laptop. That's the product. But teams need something else: a shared view that doesn't vanish when someone closes their terminal, access controls that aren't "whoever has the kubeconfig wins", and a timeline that survives past the last restart.
That's what Radar Cloud is.
TL;DR
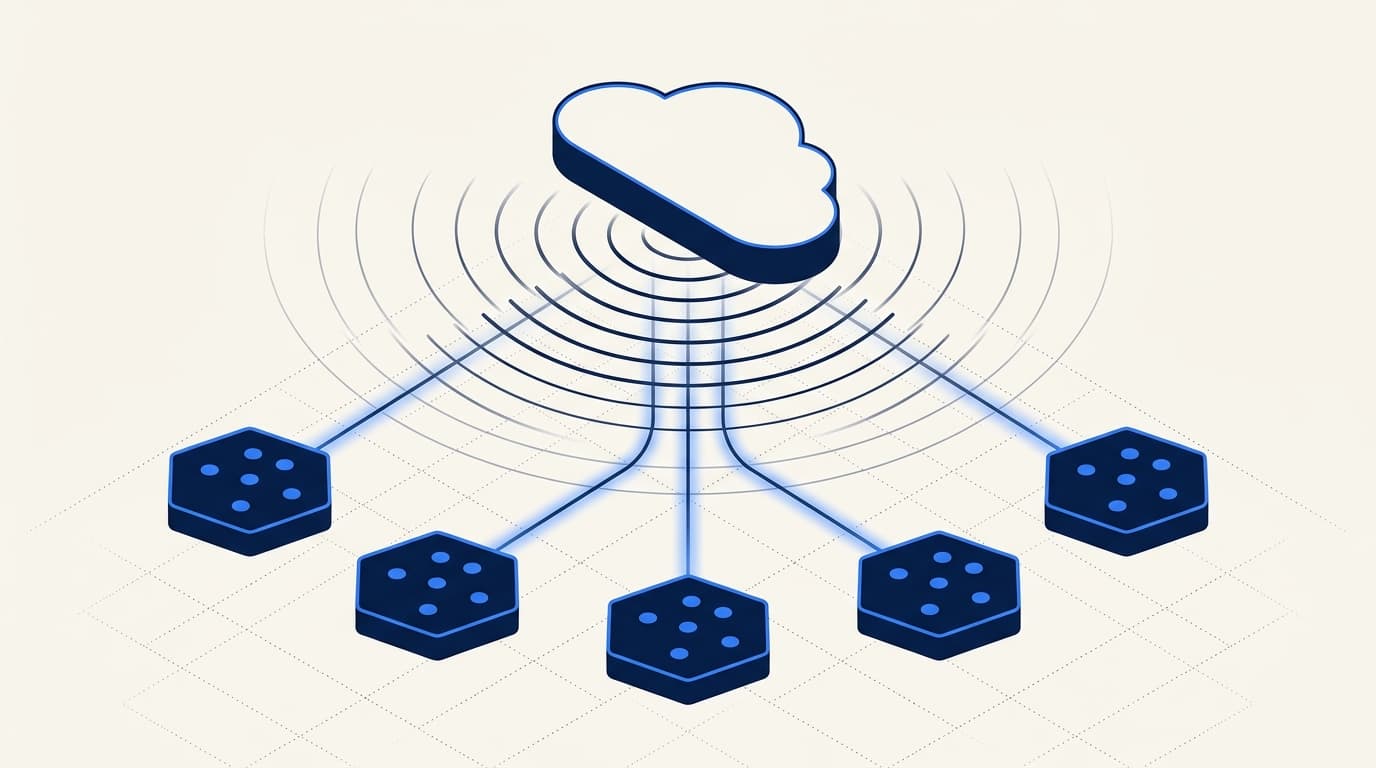
Radar Cloud is the hosted extension of Radar OSS. Radar runs in each cluster, connects outbound-only over TLS to api.radarhq.io, and Cloud reverse-proxies browser requests through to it on demand. You get fleet views across every connected cluster, SSO on every plan (including Free), Kubernetes-native scoped RBAC via impersonation, an org-scoped audit log, hub-side notifications for connection and billing events, and shareable deep links.
The control plane never caches your cluster state. Live Kubernetes state is the source of truth. Credentials stay in the cluster. Logs and exec stream on demand and are never stored at rest.
Free tier for up to 3 clusters. $99 per cluster per month on Team. Custom on Enterprise.
What OSS can't do for a team
Radar OSS is a single Go binary that runs locally against your kubeconfig or in-cluster via Helm. That architecture is a feature: nothing leaves your machine, instant startup, no account required. It's the right shape for individual debugging, regulated environments, and air-gapped clusters.
It's the wrong shape for a team of eight engineers running twelve clusters.
Five things break once you scale past one engineer and one cluster:
- No fleet view. OSS talks to whatever kubeconfig context is active. Switching contexts is manual. There's no single screen that says "across all my clusters, what's unhealthy right now?"
- No shared links. If you spot a broken pod and want to point a teammate at it, the best you can do is a screenshot. There's no URL that opens the same view on their machine.
- Whoever has the kubeconfig can do anything. OSS respects your cluster RBAC, but it doesn't layer anything on top. There's no group-to-role mapping out of the box, no audit log of who did what.
- No SSO. Access is a kubeconfig file passed around however your team passes around kubeconfig files.
- No connection-state notifications. OSS shows you what's happening when you're looking. It doesn't tell you when a cluster has gone dark while you weren't watching.
Every one of those gaps is a thing we kept hearing from OSS users. Radar Cloud closes them without changing the OSS architecture or pulling features behind a paywall.
A concrete before and after
Last month one of our early-access teams hit a cascading DNS failure that took out two services across their prod-eu cluster. Three engineers ended up debugging together across a two-hour window.
With OSS alone, every engineer was on a different laptop with a different kubeconfig context. Coordination was someone screenshotting their view into Slack, then someone else asking "is that prod-eu or prod-us?", then a fourth engineer joining and asking the same question.
With Radar Cloud, they all opened the same fleet view, picked prod-eu, and were inside the in-cluster Radar's live state - same Pods, same events, same topology. They sent a deep link to the cluster view to the SRE who joined forty minutes late, who clicked through and was looking at the right cluster's CoreDNS pods in two seconds, not asking "which cluster are we on?" again.
No heroics. Just: one URL, scoped access, and everyone looking at the same source of truth.
What Cloud adds
Fleet views
One dashboard across every connected cluster. Today's fleet views answer the questions that are painful one cluster at a time: which clusters have critical problems, where is a resource named payments-api running, which clusters still fail a specific audit check, which package versions are drifting. The views fan out to connected clusters over the tunnel and render progressively for large fleets.
Drill into any cluster and you're inside the same resource, topology, timeline, Helm, GitOps, and audit views you already know from OSS.
Cross-cluster compare
Pick two clusters and diff the same resource side by side as YAML - the fastest way to catch the staging-vs-prod drift behind "but it works on the other cluster." It's wired into fleet search, so you can jump from a match straight into compare mode.
Live timeline
Resource changes, Kubernetes events, Helm operations, and observed state transitions, served live from the in-cluster Radar pod when you open the view. In-cluster Radar can persist its timeline to SQLite when configured with a PVC, so it survives pod restarts; the soft retention budget is tunable.
SSO on every plan
WorkOS-backed SAML and OIDC. Okta, Entra ID, Google Workspace, OneLogin, and any spec-compliant SAML / OIDC provider. Self-serve setup through the WorkOS Admin Portal. Available on every plan, including Free - we don't gate identity behind a tier.
Kubernetes-native RBAC via impersonation
Three Cloud roles (owner, member, viewer) map to standard Kubernetes ClusterRoleBindings (admin, edit, view) by default. The Cloud control plane injects X-Forwarded-User and X-Forwarded-Groups, and the in-cluster Radar pod impersonates the user when it talks to the K8s API. Whatever K8s RBAC permits, the user can do. Whatever it doesn't, they can't.
You override the defaults via two lines in cloud.defaultRbac.* in the Helm values. Per-user namespace-scoped RoleBindings work too, via the cloud:user:<user_id> group. There's no parallel permission system to maintain - it's K8s RBAC the whole way down.
Audit log
Every authentication event, role change, scope change, cluster registration, and write operation through Cloud lands in an audit log. Tier-based retention: 7 days on Free, 30 days on Team, 365 days on Enterprise.
Agent and MCP governance
Radar speaks the Model Context Protocol, so AI agents - Claude, Cursor, your own in-house bots - can read live cluster state through the same backend the UI and CLI use. Cloud adds the governance layer on top: a dedicated Agents page that inventories every agent and personal access token across the org, with activity status, so you can see exactly what has access and revoke anything stale.
Because an agent runs with a user's token, it inherits that user's Kubernetes RBAC - the same impersonation model as a human, no separate permission plane. And every tool an agent can call is marked read-only or write (apply, scale, exec are write), so a read-only assistant is never quietly confused with one that can mutate prod.
Notifications
Hub-side notifications cover connection-state events (cluster.disconnected, cluster.reconnected), org membership events (org.member.invited, org.member.joined), and billing events. Configurable destinations are Slack and webhooks; there's also an always-on in-app inbox and per-user email preferences.
We're deliberately conservative on what gets pushed. The value is in the dashboard you already use, not a chatty Slack channel.
Shareable deep links
Every view has a URL. Resource detail, filtered timeline slice, topology view, cluster view. Paste it into Slack, link it from an incident doc, bookmark it. The URL preserves filters and the cluster scope.
Architecture
Radar Cloud is split in two: in-cluster Radar and a multi-tenant control plane.
In-cluster Radar is the same Go binary as Radar OSS, deployed as a Deployment via Helm. It uses the client-go SharedInformer pattern - list once per resource type, then watch deltas. No polling, no periodic full scans.
The connection is outbound-only. Radar dials api.radarhq.io:443, negotiates TLS, upgrades to a WebSocket, authenticates with a cluster-scoped bearer token, and runs yamux for stream multiplexing on top. The cluster doesn't need a LoadBalancer, Ingress, NodePort, or inbound firewall rule. If your cluster can make an outbound HTTPS call to one FQDN, Radar works. This is the property that makes Radar tolerable to security teams.
Radar runs with a scoped Kubernetes ServiceAccount. Read-only by default. You opt into write features (logs, exec, Helm management, scale, restart) per-feature if you want to drive operations from the Radar UI.
The control plane is a reverse proxy. When a browser asks for cluster data, Cloud authenticates the user, opens a fresh yamux stream over the existing WebSocket, and forwards the HTTP request through to the in-cluster Radar pod, which serves it live from its SharedInformer cache. The Hub does not store your cluster state. There is no server-side replica, no event ingest pipeline, no "stale at 5s intervals" cache. Live K8s state is the source of truth.
What the control plane does store: org membership, roles, cluster registry metadata, audit log entries, PAT hashes, billing state, and a small set of hub-native events (cluster.disconnected, member invitations, billing). That's it.
What stays in the cluster: all cluster resources, including Secret and ConfigMap values. Logs, exec sessions, and port-forwards are streamed through the tunnel on demand only when a user opens them, and are never stored at rest on the Cloud side.
Each cluster is enrolled with a bearer token issued from the Radar dashboard. The raw token is shown exactly once at creation and stored only as a SHA-256 hash bound to the cluster record. An owner can rotate it at any time, which invalidates the previous hash and forces Radar to reconnect with the new value.
Install
helm repo add skyhook https://skyhook-io.github.io/helm-charts
helm repo update

helm install radar skyhook/radar -n radar --create-namespace \
  --set cloud.enabled=true \
  --set cloud.url=wss://api.radarhq.io/agent \
  --set cloud.clusterName=prod-us \
  --set cloud.token=$RADAR_CLOUD_TOKEN
The dashboard hands you this command with the token and cluster name already filled in when you enroll a cluster.
One minute from helm install to a cluster tile lighting up green in the fleet view. After that, you don't go back to Helm to stay current: when a cluster's in-cluster Radar falls behind, the dashboard flags it and upgrades the agent in place over the existing tunnel - one click, no second helm upgrade.
A tour in five views
Fleet
The landing page. Cards for every cluster you've enrolled, grouped however you want, with health, recent warnings, and drill-in. The view OSS users have been asking for since week one.
Topology
The same structured-DAG topology from OSS, running at cluster scope. Ownership chains, Service routing, Ingress paths, ConfigMap and Secret references, HPA targets. Problem resources light up yellow or red.
One honest note: topology in v1 is single-cluster. You pick a cluster, you get its graph. Cross-cluster topology edges are on the roadmap but not in GA. We'd rather ship single-cluster topology that's correct than cross-cluster topology that fakes the edges.
Timeline
The cross-source event view from in-cluster Radar - K8s events, resource diffs, pod lifecycle, GitOps reconciles, Helm operations - served live from the in-cluster pod. Filter by cluster, namespace, resource kind, or severity. Persists across pod restarts when the in-cluster timeline is configured with SQLite storage.
Helm and GitOps
All Helm releases and Argo CD or Flux resources across every cluster. Status, chart version, app version, sync state, owned-resource health. Install, upgrade, rollback, uninstall, sync, reconcile - if Radar's ServiceAccount has write permissions in that namespace.
Notifications
Hub-side notifications cover the events the control plane actually owns: cluster disconnect and reconnect, org member invites and joins, billing failures, free-tier cap. Destinations: in-app inbox, Slack, email preferences, generic webhook. Per-user toggles for which kinds you want to hear about.
This is deliberately a small surface. Routing every K8s event into chat is the way you end up muting the channel.
What it costs
| Plan | Clusters | Audit log retention | Users | Auth | Notifications | SLA | Price |
|---|---|---|---|---|---|---|---|
| Free | 3 included | 7 days | Unlimited | SSO (SAML / OIDC) | Slack, webhook, in-app | Best-effort | $0 |
| Team | Unlimited | 30 days | Unlimited | SSO (SAML / OIDC) | Slack, webhook, in-app | 99.5% | $99 / cluster / month |
| Enterprise | Unlimited | 365 days | Unlimited | SSO + SCIM | Slack, webhook, in-app | 99.9% | Contact us |
Enterprise adds 365-day audit retention, BYOC / on-prem deployment of the control plane, US or EU data residency, SCIM 2.0 directory sync, and a dedicated CSM. Annual contracts get 20% off the Team list rate.
Billing is per connected cluster, not per node or per pod. A 3-node dev cluster and a 300-node prod cluster cost the same on Team. That's deliberate - we don't want to penalize you for running bigger workloads, and the per-cluster cost to us doesn't scale linearly with cluster size.
OSS vs Radar Cloud
| Radar OSS | Radar Cloud | |
|---|---|---|
| Install location | Your laptop or in-cluster Helm | Radar per cluster + hosted control plane |
| Clusters | One at a time | Aggregated fleet view across all connected |
| Timeline | In-memory or SQLite, in-cluster | Same in-cluster timeline, served live through reverse proxy |
| Auth | Local kubeconfig | SSO (Okta, Google, Entra ID, SAML / OIDC) on every plan |
| RBAC | Inherits kubeconfig | K8s impersonation - 3 default roles + per-user RoleBindings |
| Audit log | - | 7 / 30 / 365 days by tier |
| Notifications | None | Slack, webhook, in-app inbox (hub events) |
| Shareable views | No | Deep links per resource and view |
| Agent / MCP access | MCP server, single cluster | Same MCP, plus org-wide agent + token inventory and read-only/write tool labels |
| Price | Free forever | Free for 3 clusters, $99 / cluster / month Team, Enterprise custom |
| SLA | None | 99.9% on Enterprise |
What we are not shipping in v1
This is the honest list. Some of these will land in the next two quarters, some we're still debating.
- Cross-cluster topology edges. Single-cluster topology only in v1. Cross-cluster topology and cross-cluster timeline are on the roadmap, not shipping today.
- Custom dashboards. The views are the views. You can filter and deep-link, but you can't build your own tiles or drag widgets around. In the design queue.
- Long-term cluster-event archive. We don't store your cluster events on the control plane at all - they live in the cluster, with optional SQLite persistence in-cluster. If you need a seven-year regulatory archive, ship events to your SIEM; we're not that system.
- Self-hosted control plane below Enterprise. The BYOC / on-prem deployment path is an Enterprise feature. If you need the Radar experience inside your own infra without an Enterprise contract, the path today is Radar OSS plus the in-cluster Helm deployment.
Radar Cloud is also not a metrics platform, not an APM, and not a log aggregator. It's a Kubernetes visibility plane. Prometheus, Grafana, Datadog, and your existing log backend keep their jobs.
Why hosted when OSS exists
The obvious question: if Radar OSS is free and good, why build a paid hosted thing?
Because some things can't live on one laptop. SSO needs an identity layer. Org-scoped audit logs need a database. Notifications about a cluster going dark need a system that's awake when you're not. Cross-cluster aggregation needs a fan-in point. None of those belong in a local Go binary, and bolting them on would ruin the thing that makes OSS good.
So we drew the line cleanly.
Radar OSS stays free, stays fully featured for single-cluster work, and keeps all the views it launched with. We're not pulling topology behind a paywall. We're not crippling the Helm view. We're not adding a "cloud login required" nag screen.
Radar Cloud is the thing you reach for when one laptop isn't enough. The hosted backend is different code, the value is different. If that value is worth $99 per cluster per month to your team, great. If it isn't, OSS is still there.
That's the split. No bait-and-switch, no "community edition" with missing features, no mandatory sign-up to make OSS work. The two products serve different jobs.
Getting started
Sign up at radarhq.io and you get the Free tier immediately - 3 clusters, full SSO, unlimited teammates in your workspace. Enroll your first cluster with the Helm install above.
Full docs live at radarhq.io/docs. The OSS source is linked from the docs site.
If you're already running Radar OSS and want to try Cloud on a single non-critical cluster, the install is drop-in. You don't have to choose.
Keep reading
Why Radar Cloud Doesn't Cache Your Cluster State
Most multi-cluster dashboards copy your cluster state into a backend cache. Radar Cloud doesn't. Here's why the reverse-proxy model is the right call.
The Fleet Visibility Gap: Why Teams With 5+ Clusters Hit a Wall
Every tool that worked at 2 clusters breaks at 8. kubectl, Lens, k9s, Headlamp are all single-cluster-at-a-time. Here's where the wall is and what it looks like.
Radar v1.8: Applications, Rebuilt Navigation, and Helm Upgrade Tracking
Radar v1.8 is out: an Applications view that groups workloads into the apps they form, a ground-up navigation and search rebuild, fuller Helm operations, large-cluster performance work, and Prometheus querying over MCP.