Persistent Event Timeline: Debugging What Happened Last Tuesday
Kubernetes events vanish after an hour. Radar keeps them for 30 days. Here is how a persistent event timeline changes incident response.

Tuesday, 2:04pm. A pod in the api namespace gets OOMKilled. Kubernetes restarts it. The pod comes up, eats through its memory budget in a few minutes, gets killed again. This repeats. Alerts fire. Nobody pages. The pod stabilizes by 2:30pm because the traffic slows down, and you go home.
Tuesday, 11:47pm. Same pod, same OOMKill, same restart loop. This time the pager goes off. You drag yourself out of bed at midnight, open your laptop, and go to look at what changed earlier that day. And the Kubernetes event log is gone.
Not "hard to find." Gone. Garbage-collected by the API server, hours ago.
Why Kubernetes events vanish so quickly
Kubernetes events have a retention policy and it is aggressive on purpose. The kube-apiserver flag that controls it is --event-ttl, and the default is one hour.
kube-apiserver \
  --event-ttl=1h0m0s \
  ...
One hour. Not one day. If you want to investigate anything that happened earlier in the afternoon from your midnight pager, the API server has already deleted it.
You can raise the TTL. Some teams push it to four or six hours. A brave few push it to 24. But the reason the default is one hour is etcd: every event is a write to the control plane's datastore, and events are noisy. Raising the TTL linearly increases etcd size, which linearly increases compaction cost, which eventually affects control plane latency. On managed clusters (GKE, EKS, AKS), you often cannot change this flag at all. It is baked into the managed control plane.
So the honest read is: fixing this at the control plane level is not the right answer. You do not want your cluster API server to double as an audit log. That is what downstream systems are for.
What "persistent" means in Radar
The Radar agent watches your cluster the same way Radar OSS does - SharedInformers against the Watch API, in real time. Every Kubernetes event fires a callback the moment it happens. Every resource delta (create, update, delete, status change) fires a callback the moment it happens.
The agent ships those events out over its outbound-only mTLS connection to Radar. They land in ClickHouse, partitioned by cluster and time. They stay there.
Retention depends on your plan:
| Plan | Event timeline retention |
|---|---|
| Free | 24 hours |
| Team ($99 per cluster per month) | 30 days |
| Enterprise | 1 year+ |
The point is not the absolute number. The point is that retention outlives the incident response window. If you pull a pager at midnight for something that started degrading at 2pm, the story of the afternoon is still there when you show up.
One important detail: because the agent captures events via Watch at the moment they are emitted, it does not matter what your cluster's --event-ttl is set to. The agent sees the event, captures it, ships it. The API server can garbage-collect whenever it wants. Radar already has the record.
The UX that actually matters
Retention is the easy part of this. The interesting part is what you can do with the data once you have it.
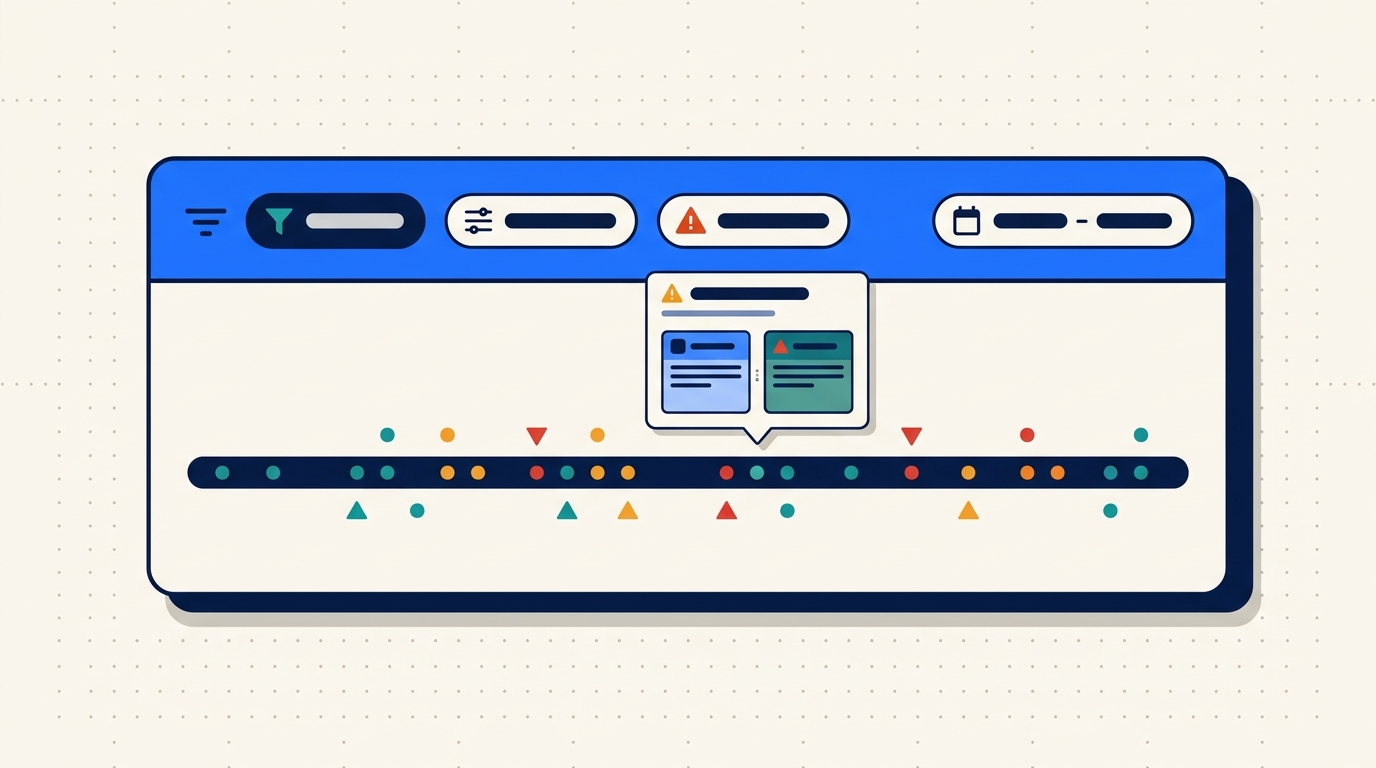
Scrub backward through time on any resource. Every resource page (pod, deployment, service, configmap) has a timeline scrubber. Drag it backward, the view reflects the state of the world at that moment - labels, annotations, replica counts, status conditions, related events. This is the "time travel" UX that made us want to build this.
Filter hard. By event type (Normal, Warning), namespace, cluster, workload, reason (OOMKilled, FailedMount, Unhealthy). Filters compose. Filters are in the URL.
Cross-reference across clusters. If the same event reason fires in prod-us and prod-eu within 60 seconds of each other, that is a signal. The fleet-scoped timeline view shows you that correlation without having to open two tabs.
Deep-link into Slack. Every timeline URL is shareable and preserves the full filter + time state. When you paste it into an incident channel, the next person who clicks it lands exactly where you were. No "scroll down to Tuesday 2pm and filter by namespace api" instructions.
A real URL looks like this:
https://app.radarhq.io/clusters/prod-us/namespaces/api/timeline
  ?from=2026-03-10T13:55
  &to=2026-03-10T14:10
  &type=Warning
Fifteen-minute window, one namespace, warnings only. Paste it anywhere.
Debugging the Tuesday OOM
Back to the scenario. It is now Wednesday 00:12. You are at your laptop, coffee, pager context loaded, pod api-7d9f is in CrashLoopBackOff.
Step one: open the pod in Radar. The timeline shows the current crash loop at the top. Below that, the previous flare at 14:02 - 14:30. You scrub the timeline back to 13:50 to see what was happening just before the first OOMKill.
At 13:58, a ConfigMap update. api-config, revision bumped from 47 to 48. You click the diff (Radar stores resource deltas, so you get the actual field-level diff, not just "something changed"):
 data:
   cache.ttl: "300"
-  cache.preload_on_startup: "false"
+  cache.preload_on_startup: "true"
   log.level: "info"
At 13:59:12, the pod rolls. New pod comes up. At 14:01:47, the first Warning event:
apiVersion: v1
kind: Event
type: Warning
reason: OOMKilled
involvedObject:
  kind: Pod
  name: api-7d9f-k2pxq
  namespace: api
message: "Container api exceeded memory limit (512Mi)"
firstTimestamp: "2026-03-10T14:01:47Z"
lastTimestamp: "2026-03-10T14:01:47Z"
count: 1
source:
  component: kubelet
  host: ip-10-0-4-212.ec2.internal
Cascade of BackOff events follow. Pod settles when cache.preload_on_startup finishes (the request volume dropped by then and the preloaded cache fit in memory). Eleven hours later the traffic pattern shifts, the preloaded cache grows past 512Mi, OOMKill returns, pager fires.
The fix is obvious once you can see the story: either raise the memory limit or turn the preload off. But without the timeline, you would be guessing from the 11pm crash alone. With it, you can point at a single ConfigMap change nine hours earlier and say "that is where this started."
Debug is not about finding the answer faster. It is about having the evidence at all.
Under the hood (briefly)
ClickHouse is doing the heavy lifting. Events are partitioned by cluster and day, compressed with ZSTD, indexed on the fields you actually filter by (namespace, kind, reason, timestamp). Query latency for a 7-day window across a fleet with 20 clusters is typically in the low hundreds of milliseconds.
On the way in, the agent redacts Secret values and strips managedFields before shipping. We store what changed about a Secret (its existence, its keys, its labels) but never what is in it. Same principle as the OSS Radar cache: keep what is useful, drop what is sensitive or heavy.
That is one paragraph of architecture. My colleague Eyal wrote a longer post on the agent and server side if you want the full picture.
What we deliberately do not do
Persistent event retention is not log retention, and we want to be clear about that.
- We do not store pod logs at rest. Logs stream on demand through the agent when you open them in the UI. The agent pulls from the node's
kubelet, and the stream lives only as long as your browser tab. This is a cost decision (logs are enormous) and a privacy decision (logs contain PII, tokens, customer data in ways events do not). - We do not generate automatic RCAs. No "AI thinks the root cause is...". We would rather show you the raw story and let you draw the conclusion. The story is usually obvious once you can see it. Guessing loses trust fast when it is wrong.
- Retention is honest per plan. 24 hours, 30 days, 1 year+. We do not cap by event count or surprise-delete older data. If your plan says 30 days, you get 30 days.
- Legal hold and compliance retention are Enterprise features. Team is 30 days, Enterprise is 1 year+, period.
Three things that make the timeline more useful
A few workflow tips after shipping this for a few months and watching how teams actually use it.
Bookmark the time-scoped URL during a live incident. When you are midway through debug, before you move on, copy the URL you have open. It preserves the exact filter state. Drop it in the incident ticket. Future-you or the next on-call will thank present-you when the post-mortem starts two days later and nobody remembers what they were looking at.
Add the Slack integration. When Radar alerts fire into Slack, the link in the alert is pre-scoped to the 15 minutes before and after the event. You click, you land on the right timeline slice, you do not waste the first 30 seconds navigating. This single piece of friction removal changes the feel of responding to a 3am page more than any other feature we have shipped.
Use the diff view on suspicious resource version jumps. If a Deployment's resourceVersion jumped at 13:58 and your incident started at 14:01, open the diff. Most of the time the change is right there. We log every field-level delta, so you see what changed and not just that something did.
The shift
Kubernetes events are ephemeral by design. That design made sense when clusters were small and incidents were short. It does not make sense now, when a pager can fire twelve hours after the change that caused the problem, and the story you need to understand is already gone from etcd.
Persistent event retention is not a fancy feature. It is the minimum for treating Kubernetes operations as a real discipline. You should not be investigating production incidents from a one-hour rolling window.
If your team has ever said "I wish I could see what was happening yesterday afternoon" - that is what this is for.
Try Radar - free tier is 1 cluster with 24-hour timeline retention, no credit card.
Keep reading
Introducing Radar: Multi-Cluster Kubernetes Visibility for Teams
Radar Cloud is the hosted multi-cluster extension of Radar OSS. Fleet view, 30-day timeline, SSO, scoped RBAC, alerts. Credentials never leave your cluster.
Your Cluster Events Are Mostly Noise. Here's How We Filter Them.
Every team has a #k8s-alerts Slack channel no one reads. Here's why naive event alerting fails and how Radar correlates, suppresses, and routes the 2% that matters.
Radar OSS or Radar Cloud? An Honest Take on When to Use Each
The most common question in our GitHub issues: do I need Radar, or is OSS enough? Here's the honest answer, with the five questions that actually decide it.