Your Cluster Events Are Mostly Noise. Here's How We Filter Them.
Every team has a #k8s-alerts Slack channel no one reads. Here's why naive event alerting fails and how Radar correlates, suppresses, and routes the 2% that matters.

Every team we meet has a #k8s-alerts Slack channel. No one reads it. That's the problem.
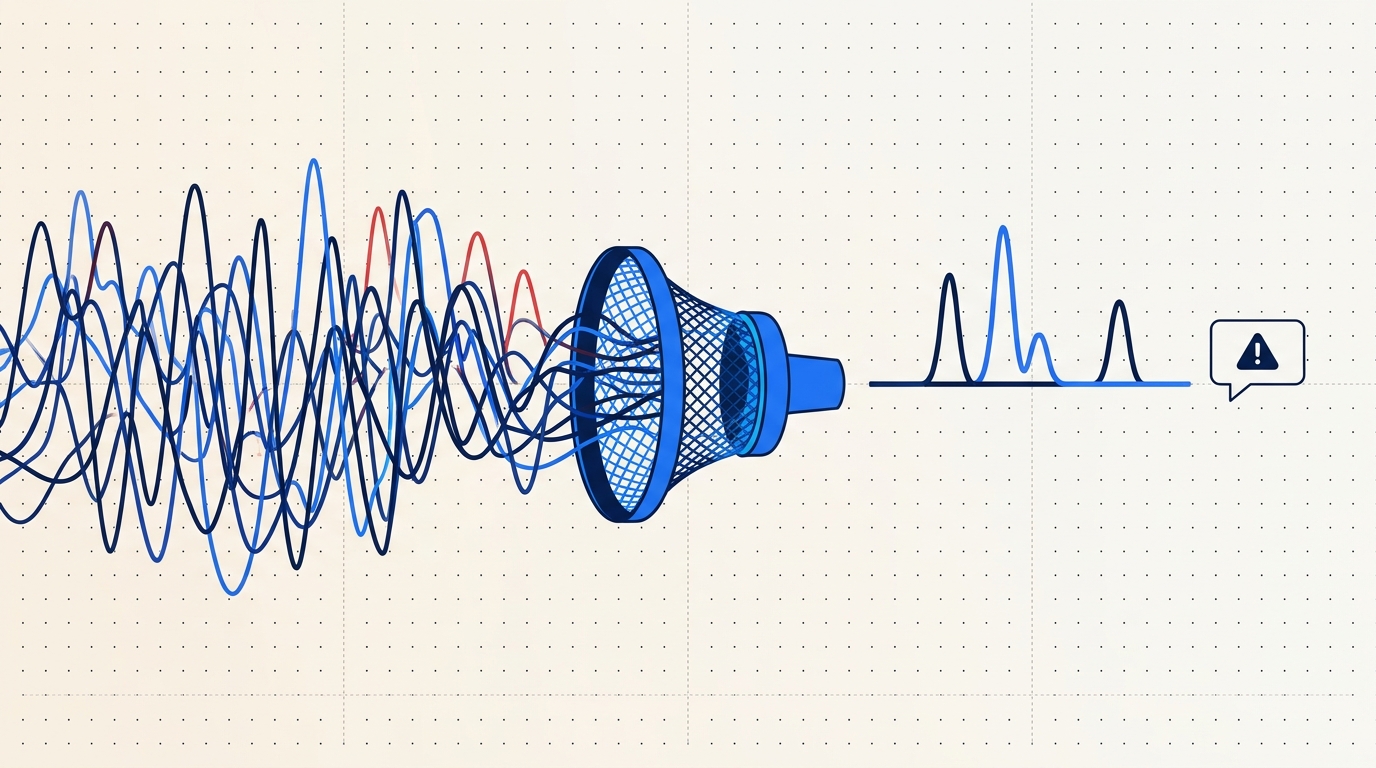
Open the channel and scroll. You'll see ImagePullBackOff on pods that recovered seconds later, FailedScheduling during a cluster autoscaler cold start, dozens of BackOff messages during a rollout, ConfigMap updates from a GitOps reconcile loop, and a handful of genuine OOM kills buried between them. The channel is a firehose. The real incidents are in there somewhere. Nobody's going to find them.
A healthy cluster is loud
A single production namespace running a handful of services emits hundreds of Kubernetes events per minute on a normal day:
- Scheduled pod replacements (rolling updates, node drains)
- HPA scale-up and scale-down cycles
- Image pull activity on cold nodes
- Node condition flaps (MemoryPressure on and off)
- Liveness probe warnings during GC pauses
- CNI chatter (IP allocations, network policy updates)
- GitOps tooling reconciling state every 3 minutes
98% of that stream is expected. The 2% you actually want to know about is the stuff that will page someone. The entire job of a good alerting system is picking that 2% out of the 98% without either drowning you in false positives or missing the real ones.
Most teams get this wrong the same way. Let's walk through the failure modes before talking about how we do it.
The four common anti-patterns
Alert on every Warning event. This is where every team starts. Your cluster emits a Warning, a webhook fires, Slack gets a message. Within an hour you've muted the channel. ImagePullBackOff is Warning-level, and during a routine rollout it's expected for the 10-30 seconds between the pod starting and the image landing on the node. FailedScheduling is Warning-level, and it fires every time the cluster autoscaler hasn't finished adding the node you need. Unhealthy fires on any failed probe, including the probe checks during normal startup. Warning is not "something's wrong." Warning is "you might want to know about this."
Alert on every pod restart. Counting restarts feels robust until you realize HPA churn during normal traffic generates hundreds of pod lifecycle events per hour, every deployment rollout produces a burst of restarts on the old ReplicaSet, and preemptible node replacement shuffles pods constantly. A single noisy deploy at 3pm means 400 Slack messages by 3:01pm.
Alert only on CrashLoopBackOff. This goes the other way - too conservative. CrashLoop requires the pod to have actually failed to start several times. You'll miss the service that's returning 5xx to half its requests but still passing its liveness probe. You'll miss the deployment whose readiness is slowly degrading because a sidecar leaks file descriptors. You'll miss OOM kills that don't recur because the pod just restarts successfully afterward. CrashLoop catches the corpses, not the sick patients.
"Just use Prometheus." Prometheus is the right tool for metric thresholds. up == 0, rate(http_requests_total{status=~"5.."}[5m]) > 0.05, CPU saturation, memory pressure. But Kubernetes events are a narrative stream, not a time series. "The pod was evicted because the node went NotReady because kubelet lost contact with the API server" is not a threshold. It's a sequence. Trying to model event correlation with recording rules and Alertmanager grouping ends with a 400-line YAML file that nobody on the team fully understands. Use the right tool for the shape of the signal.
What a useful alert actually looks like
Before describing what Radar does, here's what we were aiming for. An alert is useful if it meets all of these:
- Specific. Describes a real signal - not a known-benign state, not a transient condition that already resolved.
- Recent. Fired in the last few minutes. An alert about something that happened three hours ago and is already self-healed is a distraction, not a call to action.
- Grouped. One incident, not 300 pages. A Deployment in trouble is one thing to look at, not 40 pods each reporting their own OOMKill.
- Deep-linkable. Click the alert, land in the exact view of the exact resource at the exact time. Not "here's a log link, good luck."
- Acknowledgeable. Someone takes it. Everyone else knows it's taken.
If an alert doesn't meet all five, you'll eventually mute the channel. The goal isn't fewer alerts. It's alerts that one specific person can do one specific thing about.
How Radar correlates events
Radar ingests the full Kubernetes event stream from every connected cluster via the same agent that powers the rest of the product - outbound-only, mTLS to agents.radarhq.io:443, same SharedInformer pattern as Radar OSS. The correlation happens server-side on top of ClickHouse.
Here's the pipeline:
Dedup. Kubernetes emits the same event object repeatedly - a FailedMount on a stuck volume can fire every 30 seconds for an hour. The count field on the event object increments, but a naive consumer sees each increment as new. We fold identical (involvedObject, reason, source) tuples within a configurable window (default 60s) into a single timeline entry with a count.
Take a real event:
apiVersion: v1
kind: Event
type: Warning
reason: FailedScheduling
message: "0/6 nodes are available: 3 Insufficient memory, 3 node(s) didn't match Pod's node affinity."
involvedObject:
  kind: Pod
  name: api-7d9c8b4f-xq2mn
  namespace: production
source:
  component: default-scheduler
count: 47
firstTimestamp: "2026-03-14T10:22:14Z"
lastTimestamp: "2026-03-14T10:31:02Z"
Forty-seven firings over nine minutes. One incident. You want one Slack message, not forty-seven.
Grouping into incidents. Events on related resources roll up to the owning workload. A Pod OOMKilled event, the subsequent BackOff on the ReplicaSet, and the Deployment's ReplicaSetUpdated churn all belong to the same story. Radar walks the ownerReferences chain and groups them under "Deployment api is unhealthy" with the child events as context. When a second pod in the same Deployment OOMs three minutes later, it joins the existing incident instead of spawning a new one.
Suppression windows. Known-deploy windows suppress expected rollout chatter. When a new ReplicaSet comes up, the first 60 seconds of ImagePullBackOff, Pulling, and Created events on its pods are suppressed because they're the normal rollout sequence, not a failure. If the condition persists past 60 seconds, we un-suppress and the alert fires - that's the signal that something's actually wrong.
Thresholding. Rules can require a count before firing. "3 OOM kills in 5 minutes in namespace production" is interesting. One OOM kill on a memory-hungry batch job is often expected. Thresholds are per-rule, so you tune based on the workload.
Severity by context. The same event is not the same severity everywhere. An OOMKill in staging is INFO - somebody's experimenting. An OOMKill in production is HIGH. The rule engine lets you map severity based on cluster, namespace, or resource labels.
Default suppression rules
Radar ships with opinionated defaults. These are on for every new workspace and you can disable individually if they're wrong for your environment.
| Rule | What it suppresses | Why |
|---|---|---|
| Rollout grace window | ImagePullBackOff, Pulling, Created on pods in a ReplicaSet less than 60s old | Normal rollout sequence, not a failure |
| HPA scale churn | SuccessfulRescale events on HorizontalPodAutoscalers | Expected behavior, not an incident |
| GitOps reconcile chatter | Updated/Synced events from Argo CD / Flux controllers | Your GitOps tool doing its job |
| Node drain replacement | Evicted pods when the source node has unschedulable: true | Planned maintenance, not an issue |
| Single OOM on batch jobs | OOMKilled on pods owned by a Job with restartPolicy: OnFailure | Expected retry behavior for batch |
| Probe warmup | Unhealthy events in the first 30s of a pod's lifetime | Application warmup, not a failure |
| Node condition flap | NodeReady ↔ NodeNotReady transitions under 15s | Transient network blip, not a node outage |
Every one of these corresponds to an alert your team would have muted on day two. Suppressing them upstream means the channel stays useful.
Routing, not just filtering
Filtering the signal is only half the problem. Getting it to the right person is the other half. Radar supports Slack, PagerDuty, Opsgenie, MS Teams, and generic webhooks. The routing model maps severity plus scope (cluster, namespace, label selector) to destinations.
A realistic routing config:
routes:
  - match:
      severity: critical
      cluster: prod-us-east
    destinations:
      - type: pagerduty
        service: platform-oncall
      - type: slack
        channel: "#incidents-prod"

  - match:
      severity: high
      cluster: prod-us-east
      namespace: payments
    destinations:
      - type: slack
        channel: "#payments-alerts"
        mention: "@payments-oncall"

  - match:
      severity: high
      cluster: staging
    destinations:
      - type: slack
        channel: "#staging-noise"

  - match:
      severity: info
    destinations: []  # explicitly drop
The "explicitly drop" at the bottom is important. INFO alerts are kept in the timeline for post-hoc debugging but don't page anyone. Critical in prod pages PagerDuty and announces in a dedicated incidents channel. High-severity in the payments namespace tags the on-call rotation directly. Staging noise goes to its own channel that nobody has notifications on but anyone can scroll when debugging.
What the Slack message looks like
When an incident fires, this is roughly the payload you get in Slack:
{
  "title": "Deployment api is unhealthy",
  "severity": "high",
  "cluster": "prod-us-east",
  "namespace": "production",
  "workload": "Deployment/api",
  "first_seen": "2026-03-14T10:22:14Z",
  "last_seen": "2026-03-14T10:31:02Z",
  "event_count": 47,
  "involved_resources": 6,
  "reasons": ["OOMKilled", "BackOff", "FailedScheduling"],
  "summary": "6 pods affected. 3 OOMKilled in last 5m. ReplicaSet api-7d9c8b4f at 2/10 ready.",
  "link": "https://app.radarhq.io/c/prod-us-east/ns/production/workload/api?t=2026-03-14T10:22:14Z",
  "actions": ["ack", "snooze_30m", "view_timeline"]
}
One incident, one message, with the count and the shape of the problem up front. The link lands you in Radar scoped to the workload, with the timeline already filtered to the incident window. The Ack button assigns the incident to whoever clicked it so the rest of the team knows it's handled.
When defaults aren't enough
The built-in rules cover the common cases. For the uncommon ones, custom rules:
alerts:
  - name: postgres-replication-lag
    description: "Postgres replica lagging behind primary"
    match:
      event:
        reason: ReplicationLag
        involvedObject:
          kind: StatefulSet
          labelSelector:
            app: postgres
            role: replica
      cluster: prod-*
    threshold:
      count: 2
      within: 3m
    severity: high
    route: payments-oncall

  - name: cert-manager-renewal-failure
    description: "TLS cert failed to renew"
    match:
      event:
        reason: ErrIssuing
        source:
          component: cert-manager
    threshold:
      count: 1
      within: 1m
    severity: critical
    route: platform-oncall
The rule language takes event fields, label selectors, cluster globs, thresholds, and a route. Rules evaluate server-side against the ClickHouse event stream, so adding a rule doesn't add load to your cluster.
Tradeoffs and gotchas
A few things to be honest about.
The first week is tuning. You'll mute some things. Maybe your workload genuinely runs OOM on purpose as part of a chaos test, so the default "3 OOMs in 5 minutes in prod" rule needs to be scoped out of that namespace. Tuning isn't failure. It's the point. The difference from the naive approach is that you're tuning at the rule level instead of muting the whole channel.
Grouping can over-merge. In noisy namespaces where three unrelated workloads all have issues simultaneously, they might get grouped under a namespace-level incident when you'd rather see them separately. Thresholds and explicit per-workload rules mitigate. If this matters to you, set the group scope to workload instead of namespace for the relevant rule.
We don't alert on absence of events. If your app stops emitting logs or your metrics flatline, Radar won't catch it because there's nothing to catch. That's Prometheus territory - absent() queries, up == 0, dead-man switches. Use Prometheus for that, use Radar for event narratives. The two are complementary, not competing.
Suppression is not deletion. Suppressed events still land in the timeline. If you're debugging an incident and need to see the full unfiltered stream - including the stuff that didn't alert - the timeline has it. Suppression is about who gets paged, not about what gets recorded.
The point
Alerts exist to make one specific person do one specific thing. A channel that fires 400 times an hour doesn't do that. A channel that fires twice a week about the things that actually need humans does.
Getting from the first kind to the second isn't magic. It's deduping, grouping, suppressing the expected, thresholding the uncertain, and routing by severity and scope. Radar does this out of the box, and lets you customize the pieces that are wrong for your environment. The #k8s-alerts channel can be useful again. It just needs to stop being a firehose.
Keep reading
Persistent Event Timeline: Debugging What Happened Last Tuesday
Kubernetes events vanish after an hour. Radar keeps them for 30 days. Here is how a persistent event timeline changes incident response.
Multi-Cluster Topology: Cross-Cluster Service Maps That Don't Hairball
Cross-cluster service topology is hard because Kubernetes itself has no multi-cluster graph. Here's how Radar builds one without turning it into a hairball.
Fleet-Scale Informers: Watching Thousands of Watch Streams Without Melting
SharedInformer is great until you need a thousand of them. How Radar's backend keeps a live server-side replica of every connected cluster without melting.