Multi-Cluster Topology: Cross-Cluster Service Maps That Don't Hairball
Cross-cluster service topology is hard because Kubernetes itself has no multi-cluster graph. Here's how Radar builds one without turning it into a hairball.

A Payments service in cluster us-east calls a PostgreSQL in cluster db-shared, which in turn fans out to a Stripe webhook receiver in cluster eu-west. 500 errors spike. Which cluster's dashboard do you open first?
The honest answer is none of them, because no single cluster's dashboard can see the whole call graph. Each cluster's API server only knows about its own Services, its own Endpoints, its own NetworkPolicies. The wire truth - who actually talked to whom - is spread across three different control planes and, often, three different observability stacks.
When we shipped Radar GA in February, we said cross-cluster topology was not in v1. We didn't want to ship a demo. The single-cluster topology view in Radar OSS works because we chose structured DAG layout over force-directed physics. Extending that honestly to a fleet is harder than it looks.
This post is the follow-up. Cross-cluster topology is shipping in Radar this month. Here's what's in it, what's not, and why.
Why cross-cluster topology is hard
Kubernetes itself has no native multi-cluster graph. Services don't know about other clusters. There's no API object that says "this Deployment in cluster A depends on this Service in cluster B." Every cross-cluster edge is either declared somewhere (and those declarations are scattered across object kinds) or observed on the wire (and observation requires infrastructure most teams haven't installed uniformly).
Service meshes solve part of this. Istio has east-west gateways. Linkerd has multicluster. Cilium Cluster Mesh makes Services routable across clusters with flat pod networking. If your fleet runs one of these end-to-end, you already have a pretty good view of cross-cluster flows - within the mesh's observability UI. Most teams haven't deployed a mesh uniformly. They have Istio in two clusters, a managed service mesh in one, and nothing in the rest.
Then there's the DNS and IP layer. An ExternalName Service in cluster A pointing at a hostname that resolves to cluster B's LoadBalancer is a real dependency. The API server in cluster A doesn't know that. Neither does the one in cluster B. Only the resolver does.
And finally, there's the rendering problem. A fleet with 20 clusters and 500 services will produce a graph that, drawn naively, is unreadable. This is the old Weave Scope problem at a larger scale. If you pick the wrong layout strategy, the whole view is useless no matter how good the data is.
What Radar ships
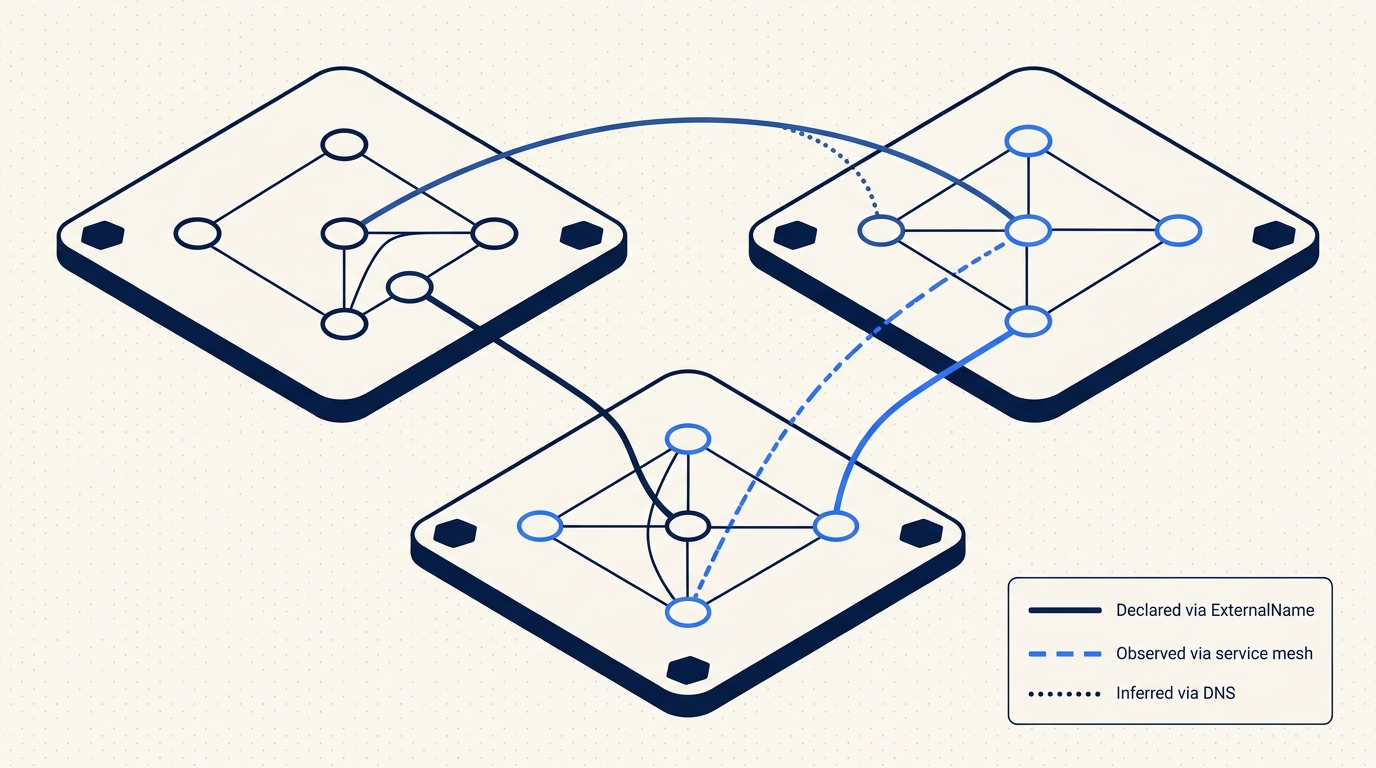
We build the cross-cluster DAG from three separate sources, and we are explicit about which source an edge came from.
Declared edges. These come straight from Kubernetes API objects. An ExternalName Service in one managed cluster pointing at a hostname inside another managed cluster's domain is a declared edge. An Endpoints object with an IP that resolves inside another cluster's pod CIDR is a declared edge. A Gateway API HTTPRoute with a parentRef pointing at a Gateway we know lives in a different cluster is a declared edge. NetworkPolicy ipBlock rules that cover another cluster's CIDR count, too.
Here's the shape of the most common declared edge:
apiVersion: v1
kind: Service
metadata:
  name: stripe-webhooks
  namespace: payments
spec:
  type: ExternalName
  externalName: webhooks.payments.eu-west.internal
If webhooks.payments.eu-west.internal resolves to an IP in a cluster enrolled with Radar, that's an edge from cluster us-east/payments/stripe-webhooks to the target Service in eu-west. We show it, and we tag it as declared.
Observed edges. When a traffic source is available, we aggregate actual flows into the DAG. Radar OSS already does this for single-cluster via Cilium Hubble and Caretta. In Radar, we extend it across the fleet: Cilium Cluster Mesh's Hubble events, Linkerd multicluster tap, and Istio east-west traffic telemetry. If your fleet has one of these installed, the agent in each cluster ships the cross-cluster flow samples to Radar, and we stitch them into a single DAG. No sidecar injection, no control plane changes. We read what your mesh already emits.
Inferred edges. Some cross-cluster dependencies are real but not visible in either the API or in mesh telemetry. A pod in cluster A makes an HTTP call to orders.api.svc.cluster.local, the cluster DNS resolves it to a ClusterIP, and that ClusterIP happens to be routable into cluster B because the two share a flat network or are VPC-peered with a CoreDNS stub. That edge is real. To catch it, the agent records DNS resolutions and outbound connection destinations at the node level (via conntrack sampling, not eBPF, so we don't require a kernel-level agent). If the destination IP falls in another managed cluster's pod CIDR, we show the edge as inferred and label it as such. Inferred is not the same as observed. The UI distinguishes them.
Here is the summary, because this is the kind of table you want to be able to point at in a review:
| Edge type | Source | Confidence | Typical coverage |
|---|---|---|---|
| Declared | ExternalName, Endpoints, HTTPRoute parentRef, NetworkPolicy | High (API truth) | ~30-40% of cross-cluster dependencies |
| Observed | Cilium Hubble multicluster, Linkerd tap, Istio telemetry | High (wire truth) | Up to 100% - only within mesh-covered clusters |
| Inferred | DNS resolution + conntrack destination in a managed cluster's CIDR | Medium (labeled "inferred") | Fills gaps where no mesh is installed |
You won't see exact percentages in the UI. You will see per-edge provenance.
The structured DAG principle, at fleet scale
The design decision we made for single-cluster topology - structured DAG layout instead of force-directed physics - matters more at fleet scale, not less. A force-directed graph with 500 nodes and 1200 edges is a hairball no matter how clever the repulsion constants are. Humans read layered layouts. They don't read blobs.
In the cross-cluster view, each connected cluster is a group lane. Services inside the cluster are nodes inside the lane. Cross-cluster edges are drawn as distinct links between lanes and are rendered on top so they don't get buried under intra-cluster traffic. Namespaces inside a cluster become sub-lanes when you zoom in. Ownership edges (Deployment to ReplicaSet to Pod) are collapsed by default at the fleet zoom level and expand as you drill down.
A concrete example from one of our own staging environments. Three clusters, six services:
cluster us-east:
  payments/api           -> db-shared/postgres/primary      (declared: ExternalName)
  payments/api           -> eu-west/webhooks/stripe-ingress (observed: Hubble)
  checkout/frontend      -> payments/api                    (intra-cluster)

cluster db-shared:
  postgres/primary       -> us-east/payments/api            (observed: reverse of above)
  backups/wal-shipper    -> eu-west/archive/s3-proxy        (inferred: DNS + CIDR)

cluster eu-west:
  webhooks/stripe-ingress -> payments/events-kafka          (observed: Linkerd tap)
  archive/s3-proxy        -> (external S3)                  (external, not in DAG)
At fleet zoom, you see three lanes and the cross-cluster edges between them. The backups/wal-shipper edge is dashed and tagged inferred so nobody treats it as gospel. Click a lane, the view reframes onto that cluster's internal topology. Click an edge, you get a scoped request-level view if an observation source is attached.
Filters that make the view usable
Without filters, any large fleet's DAG is overwhelming. The filters that matter in practice:
- By app label. Show me everything with
app.kubernetes.io/part-of=checkoutacross the fleet, regardless of namespace. - By namespace. The
paymentsnamespace across all clusters, as if it were one thing. - By protocol. Only HTTP, only gRPC, only TCP without mesh coverage.
- By activity. Only edges that actually carried traffic in the last 15 minutes. Declared edges that never fire are still visible, but dimmed.
- By provenance. Hide inferred edges if you only trust high-confidence data, or isolate inferred edges to audit the gaps in your mesh coverage.
These compose. "Checkout, gRPC only, active in the last 15 minutes, observed sources only" is a reasonable question to ask during an incident, and it should render fast.
Latency and health overlays
When an observation source is attached, edges are colored by p95 latency or error rate, configurable per view. Thresholds are per-edge (you can set different SLOs for payments -> postgres and checkout -> payments) with sensible defaults. Click an edge, you get a time-scoped drill-down of requests between the two services - p50, p95, p99 latency, error rate, and a sample of individual requests if your source supports it.
Declared and inferred edges without an observation source don't get colored. They stay neutral so you don't mistake "no data" for "healthy."
What we don't do
Radar is not a service mesh. We do not inject sidecars. We do not handle mTLS. We do not route traffic. If your east-west path between us-east and eu-west is unencrypted, we will not fix that for you. We will show you the edge, tell you what kind of traffic runs over it, and leave the remediation to Istio or Linkerd or whatever your platform team has decided to run.
Inference is always labeled. "Inferred via DNS" is not the same as "Observed via Hubble." If a view is ambiguous, we err on the side of showing less. We would rather miss an edge than show a fake one with false confidence.
We don't make east-west routing recommendations. We don't tell you "move this service to that cluster." Topology is an input to those decisions, not a substitute for them.
How to try it
If your agent is already up to date (version 1.3.0 or later), cross-cluster topology for declared and inferred edges is on by default. No agent changes. Open the fleet view, switch to the new Topology tab, select the clusters you want in view.
For observed edges, the agent needs to know where your mesh telemetry lives:
helm upgrade radar-cloud-agent skyhook/radar-cloud-agent \
  --namespace radar-cloud \
  --set token=$RADAR_HUB_TOKEN \
  --set observability.hubble.enabled=true \
  --set observability.hubble.relayAddress=hubble-relay.kube-system:80
Linkerd and Istio have equivalent flags. The agent reads from the existing relay or telemetry endpoint - we don't add a second one.
Shipping this honestly
We sat on cross-cluster topology for two release cycles because the first two prototypes were lying to users. The first force-directed prototype was pretty in demos and useless in a real fleet. The second version showed inferred edges indistinguishably from observed ones, and when we caught ourselves misreading our own UI during an internal incident, we pulled it.
What ships today is narrower than what we sketched in January. It's a DAG with explicit provenance per edge, structured layout, filters that compose, and no pretense of being a mesh. If you run one cluster, Radar OSS is still the right tool. If you run ten, this is the view we wished we had.
Keep reading
Introducing Radar: Multi-Cluster Kubernetes Visibility for Teams
Radar Cloud is the hosted multi-cluster extension of Radar OSS. Fleet view, 30-day timeline, SSO, scoped RBAC, alerts. Credentials never leave your cluster.
Your Cluster Events Are Mostly Noise. Here's How We Filter Them.
Every team has a #k8s-alerts Slack channel no one reads. Here's why naive event alerting fails and how Radar correlates, suppresses, and routes the 2% that matters.
Fleet-Scale Informers: Watching Thousands of Watch Streams Without Melting
SharedInformer is great until you need a thousand of them. How Radar's backend keeps a live server-side replica of every connected cluster without melting.