Fleet-Scale Informers: Watching Thousands of Watch Streams Without Melting
SharedInformer is great until you need a thousand of them. How Radar's backend keeps a live server-side replica of every connected cluster without melting.

SharedInformer is great. Until you need a thousand of them.
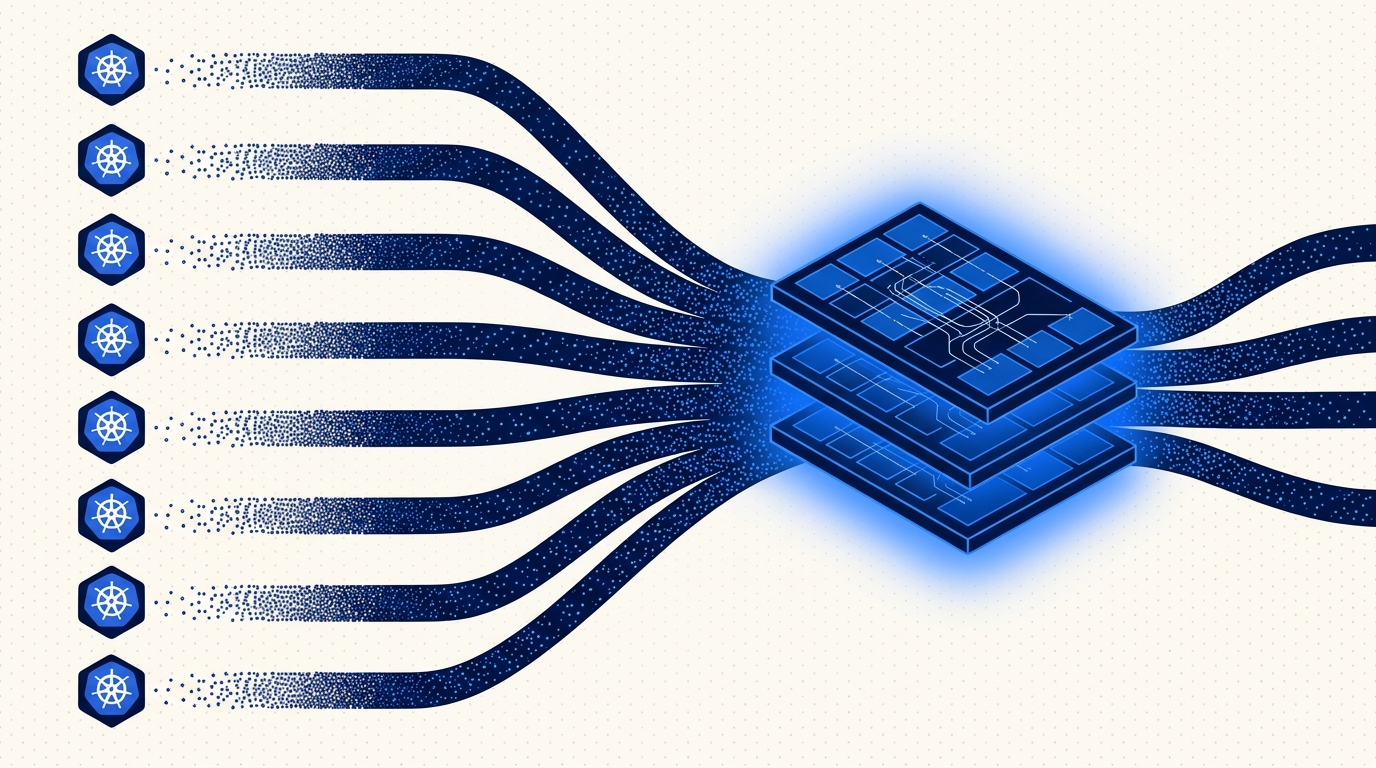
The first time we wired up the Radar backend to keep a live in-memory replica of every connected cluster, we did the naive thing - spun up one informer set per cluster inside a single Go process, ran it against ~40 customer clusters in staging, and watched the RSS graph climb past 18GB. Goroutines were north of 80k. The thing was, by every other measure, working fine. The API server on each side was happy. Watch events were flowing. It just wouldn't fit in a machine we could afford to run in production.
That afternoon we accepted what was already obvious: at fleet scale, the pattern that ships inside every Kubernetes controller is the wrong pattern. Not because it's broken - it isn't - but because it assumes one process watches one cluster. The moment N becomes thousands, the assumptions behind the pattern collapse in ways that aren't immediately obvious.
This post is about what actually breaks, and what Radar ships instead.
A two-sentence primer on SharedInformer
If you've written a Kubernetes controller you can skip this. A SharedInformer does one LIST to populate an in-memory Indexer, then switches to a long-lived watch connection; subsequent add/update/delete events flow through a delta FIFO into the Indexer, and event handlers fire on each delta. The Radar agent architecture post covers how we use SharedInformer inside the Radar agent for single-cluster caching, including the managedFields stripping that gets you ~30% memory back per object. The point for this post: the pattern is tuned for a single workload watching a single apiserver.
Where the naive fleet approach breaks
Imagine you try to centralize informer work. One backend process, one SharedInformerFactory per customer cluster, talking out to each customer's apiserver. Here is the rough shape of what falls over, roughly in order:
Memory. A typed informer cache for a moderately sized cluster (~500 pods, ~50 services, ~30 deployments, plus the usual suspects) sits around 25 MB after you strip managedFields and last-applied-configuration. At 1,000 clusters that's 25 GB of steady-state heap, before any Go overhead, before CRDs, before the delta FIFO, before the HTTP/2 framing buffers. You're now sized like an in-memory database. One GC pause ruins your day.
File descriptors and connections. Each SharedInformerFactory opens watch connections - one per GroupVersionResource it's watching. Even with HTTP/2 multiplexing that's one TCP connection per apiserver per factory. 1,000 clusters = 1,000 long-lived outbound connections from one process, plus whatever your sidecars and metrics want. Tune ulimit all you like; the kernel's conntrack table, the load balancer in front of you, and your egress NAT all have opinions.
Goroutines. Ballpark 32 goroutines per typed informer factory before you add dynamic CRD informers. 1,000 × 32 = 32,000 goroutines just for core resources. Add 20 CRDs per cluster on average and you're at 80k+. The scheduler handles it, but pprof becomes unreadable and your stack-dump-on-panic is a novel.
Resync storms. The worst one. When an apiserver restarts (GKE node upgrade, EKS control plane replacement, anyone's routine Tuesday), every watch disconnects. Every informer relists. If 300 of your 1,000 customers happen to be on the same cloud region rolling the same day, you get 300 simultaneous LISTs inbound to your process and the matching outbound pressure on each apiserver. A cluster with 5k objects produces a 50 MB protobuf response. You just pulled 15 GB over the wire in a 30-second window, and your own apiservers - the ones of your customers - are rate-limiting you.
So running informers centrally, against customer clusters, from one backend process, is a non-starter. The fix is architectural, not a flag you tune.
What we actually ship
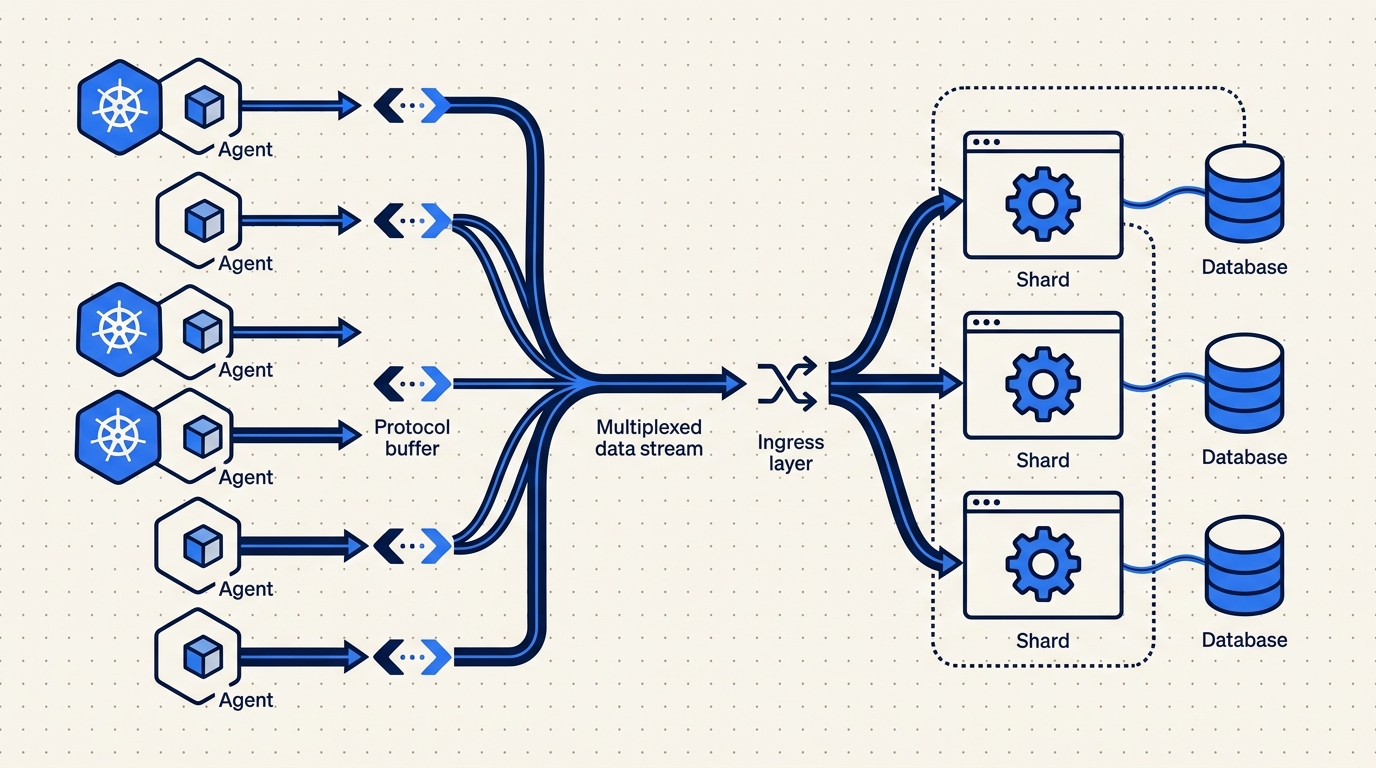
Radar pushes the informer work to the edge. Each customer cluster runs a small Go agent (~32 MB RSS steady state) deployed via Helm. The agent runs SharedInformers against its local apiserver - exactly the same pattern we use in the Radar OSS binary - and streams pre-digested deltas up to agents.radarhq.io:443 over a single multiplexed HTTP/2 connection, mutual TLS. Outbound only. No inbound ports on the customer side.
This buys us four things, in rough order of importance:
- Per-tenant memory isolation. The 25 MB of informer cache for your cluster lives in your cluster, not in our backend process. A customer with 50k objects costs them 250 MB and us almost nothing (we'll get to what "almost" means).
- Blast radius containment. A broken informer on one customer's cluster can't OOM a shared backend process. At worst it crashes their agent, which Kubernetes restarts.
- Quota and shaping at the edge. The agent can rate-limit, sample, and drop before anything crosses our perimeter.
- Horizontal scaling becomes trivial. Our backend scales with the number of delta streams we ingest, not with the total object count across all clusters. Scaling the fleet doesn't change how much RAM any single backend process needs.
The delta envelope the agent sends up is boring on purpose. Here's roughly what it looks like in protobuf, with the Go type I'd give to a new engineer:
// ResourceDelta is the unit of state change streamed from agent to backend.
// One delta = one add/update/delete for one Kubernetes object.
type ResourceDelta struct {
    // Which cluster this came from. Set by the backend after mTLS auth,
    // not trusted from the wire.
    ClusterID string `protobuf:"bytes,1,opt,name=cluster_id"`

    // Kubernetes identity triple. GVK + namespace + name.
    APIVersion string `protobuf:"bytes,2,opt,name=api_version"`
    Kind       string `protobuf:"bytes,3,opt,name=kind"`
    Namespace  string `protobuf:"bytes,4,opt,name=namespace"`
    Name       string `protobuf:"bytes,5,opt,name=name"`

    // Op is one of ADD, UPDATE, DELETE. SYNC is used during
    // post-reconnect replay (see "gotcha" below).
    Op DeltaOp `protobuf:"varint,6,opt,name=op"`

    // ResourceVersion from the apiserver. Monotonic per resource,
    // used for ordering and replay.
    ResourceVersion string `protobuf:"bytes,7,opt,name=resource_version"`

    // Agent-side timestamp, not apiserver time. Used for timeline
    // ingest, not for correctness.
    ObservedAt int64 `protobuf:"varint,8,opt,name=observed_at"`

    // Payload is the trimmed object. managedFields and
    // last-applied-configuration are already stripped agent-side.
    // Empty for DELETE.
    Payload []byte `protobuf:"bytes,9,opt,name=payload"`
}
Two details worth calling out. First, ClusterID is overwritten by the backend after mTLS auth - we never trust it from the wire. The agent's client cert tells us which tenant it is. Second, the payload is already trimmed on the agent side, so the backend doesn't pay the cost of shipping managedFields across the internet just to drop them on arrival. At typical churn, that alone cuts our ingress bandwidth in half.
Server-side replica: shards, not a monolith
We still need a server-side replica of each cluster's state. The fleet view, the topology renderer, the API - none of them want to round-trip to the agent to answer "what pods are in namespace prod?". So the backend keeps its own in-process cache per cluster. The difference from naive is that no single process holds all of them.
The backend is horizontally partitioned. Each cluster's replica is owned by exactly one shard process, chosen by consistent hashing on the cluster ID. Shards are boring Go services behind a routing layer; a typical production shard owns somewhere between 200 and 500 cluster replicas. When a shard is hot, we bump the replica count and the hash ring redistributes. When a shard dies, a standby takes over the affected clusters from a checkpoint plus a short replay of the last few seconds of the upstream Kafka partition.
The in-memory layout per cluster is an Indexer that looks a lot like the one SharedInformer builds, just fed from the delta stream instead of the apiserver directly:
type ClusterReplica struct {
    clusterID string

    // One Indexer per GVK. Same type client-go uses.
    indexers map[schema.GroupVersionKind]cache.Indexer

    // Last applied ResourceVersion per (GVK, namespace). Used to
    // detect gaps after reconnect.
    rvCursor map[gvkKey]string

    // Subscribers - fleet view, topology, alerts, API. Each gets
    // a bounded channel. Slow subscribers are dropped, not blocked.
    subs []*subscriber
}

func (r *ClusterReplica) Apply(d *ResourceDelta) error {
    idx := r.indexerFor(d.Kind, d.APIVersion)
    obj, err := decode(d.Payload)
    if err != nil {
        return err
    }
    switch d.Op {
    case DeltaOp_ADD, DeltaOp_UPDATE, DeltaOp_SYNC:
        _ = idx.Add(obj)
    case DeltaOp_DELETE:
        _ = idx.Delete(obj)
    }
    r.advanceCursor(d)
    r.fanout(d, obj)
    return nil
}
Shard state is checkpointed to S3 every 30 seconds. A checkpoint is a gzipped protobuf snapshot of all Indexers plus the RV cursor map. Recovery on a standby is: load the latest checkpoint, seek to the checkpoint's offset in the Kafka partition that carries the upstream deltas, replay forward. Typical recovery time for a 300-cluster shard is under 10 seconds, most of it S3 download.
A real gotcha: partial resync storms on reconnect
The honest part of any fleet architecture is the failure mode the diagram doesn't show. For us, it's what happens when many agents reconnect at once.
An agent loses its HTTP/2 connection - maybe we deployed a new ingress, maybe their egress NAT reset. On reconnect, the agent doesn't know what state we have. If we do nothing, the safe-but-expensive move is to relist every resource type and re-send everything. Do that across 500 reconnecting agents at once and you've just created the same inbound storm we were trying to avoid in the first place, only now it's happening inside our own system.
What we do instead: every delta carries a ResourceVersion, and the agent keeps a per-GVK cursor of the last RV it successfully shipped. On reconnect, the backend sends back the cursor it has for that cluster. The agent uses it as the resourceVersion on its local informer's next watch, which lets the apiserver either resume the stream (the common case) or return 410 Gone. Only on 410 do we fall back to a relist, and even then we rate-limit the relist to one GVK at a time per cluster.
At the ingress layer we cap total concurrent relists across the fleet. If we cross the cap, agents queue up. An agent sitting in the relist queue keeps serving the last-known state from its local Indexer; the only thing that's delayed is the backend catching up on what it missed during the disconnect. That tradeoff - degrade catch-up latency to protect total throughput - is one we make on purpose.
We got this wrong the first time. Early on, we didn't carry cursors across reconnects and we saw a characteristic sawtooth in ingress CPU every time we rolled the agent gateway. Took us an evening to diagnose, about a week to ship the fix properly.
Backpressure and quotas
The other failure mode: a single agent going berserk. A customer applies a Kustomize that accidentally regenerates 10k ConfigMaps. The agent's local informer is fine - it just sees 10k update events. The stream to us is not fine.
We enforce a per-cluster ingress rate limit (deltas per second, configurable per plan). When a cluster exceeds it, the agent switches into a "lossy" mode: it stops streaming every intermediate state and instead coalesces updates by object key, shipping only the latest known state for each object every N seconds. The in-cluster Indexer still holds the full truth. The timeline loses some intermediate frames, and we emit a quota warning on the dashboard.
The important property is that one noisy cluster can't degrade any other tenant. Shards are process-isolated and the routing layer applies admission control per ClusterID before a delta ever reaches a shard's channel.
Why ClickHouse for the timeline
Live replica is one thing. Historical timeline is another, and they want different storage.
Steady-state event rate for an active cluster sits around 80-200 deltas/sec during deploys, 5-20/sec idle. Call it 10/sec average, which is 864,000 events per day per cluster. Across a fleet of 1,000 clusters with 30-day retention (the Team plan default), that's ~26 billion rows to keep queryable.
Postgres was our first attempt and it did not survive contact with that math. We briefly ran the timeline on Postgres during private beta - partitioned tables, aggressive VACUUM, the works. It was fine for tens of clusters and fell off a cliff somewhere around 80. Ingest was the easy part; the problem was that nearly every timeline query is "give me everything that happened in this namespace between T and T+N, ordered by time" across billions of rows, and that's a scan no amount of B-tree indexing makes cheap.
ClickHouse eats that query profile for breakfast. Sorted-by-time MergeTree tables, ZSTD compression on the payload column, and columnar scans over the time range make a 30-day namespace query return in well under a second. Compression ratios on the trimmed delta payloads run around 12-15x in production, which is what makes the retention math tractable in the first place.
Indicative numbers
Real numbers from our staging fleet, running a mix of small (single-node kind) and medium (30-60 node EKS) clusters. Treat these as directional, not SLAs.
| Clusters connected | Shard RSS (avg) | Shards running | Ingress deltas/sec | ClickHouse ingest |
|---|---|---|---|---|
| 100 | 420 MB | 1 | ~1,200 | ~4 MB/s |
| 500 | 1.1 GB | 2 | ~6,400 | ~22 MB/s |
| 1,000 | 1.3 GB | 4 | ~12,800 | ~44 MB/s |
| 2,500 | 1.4 GB | 8 | ~32,000 | ~110 MB/s |
Per-cluster steady state on the backend is roughly 2-4 MB of Indexer RAM (much less than the 25 MB agent cache, because we keep a summarized view and rely on the agent for on-demand deep queries), 5-15 deltas/sec average, and 150-450 MB/day of compressed ClickHouse ingest at typical churn.
Most of the interesting cost is not linear in cluster count - it's in the long tail. Five percent of customer clusters produce forty percent of the deltas. The quota and coalescing machinery exists for them.
What the pattern is, stated plainly
If you find yourself wanting one backend process to run informers across N customer clusters, the pattern you want is:
- Do the SharedInformer work at the edge, in a per-cluster agent.
- Ship trimmed deltas up a single mTLS connection.
- Keep a per-cluster replica on the backend, sharded by consistent hashing, owned by exactly one shard process.
- Checkpoint shards for fast recovery, use RV cursors to avoid resync storms on reconnect, and apply per-tenant quotas at ingress.
- Split live replica (hot, in-memory) from historical timeline (columnar, compressed).
None of the individual pieces are novel. The only thing that matters is noticing early that one process per cluster is the wrong answer, and that one process for all clusters is also the wrong answer. What you want is a shard holding a bounded number of replicas, each fed by an agent that did the hard work locally.
That's what runs behind every fleet view in Radar today. The agent is still the same client-go SharedInformer pattern we've been shipping since the OSS Radar release - it's just now that every one of them is also the first link in a chain that survives thousands of its siblings.
Related: the Radar agent architecture — how the in-cluster side looks end to end.
Keep reading
The Radar Agent: Outbound-Only, Scoped, and 32MB
How the Radar agent works: outbound-only TLS, read-only RBAC by default, ~32MB RSS. The five questions every platform team asks, answered.
Multi-Cluster Topology: Cross-Cluster Service Maps That Don't Hairball
Cross-cluster service topology is hard because Kubernetes itself has no multi-cluster graph. Here's how Radar builds one without turning it into a hairball.
Your Cluster Events Are Mostly Noise. Here's How We Filter Them.
Every team has a #k8s-alerts Slack channel no one reads. Here's why naive event alerting fails and how Radar correlates, suppresses, and routes the 2% that matters.