Kubernetes Rightsizing: Which Requests to Change, and When Not To
How to right-size Kubernetes CPU and memory requests with Prometheus, and when HPA, OOMKills, bursty usage or throttling should stop a reduction.
Most clusters reserve capacity nobody uses: request 500m of CPU, use 90m of it, and the other 410m stays booked on a node for every replica of every workload. You pay for that in nodes the autoscaler cannot consolidate. The hard part is the next question - which of those requests is actually safe to change.
A usage number on its own does not answer it. A workload sitting at a quarter of its CPU request might be over-provisioned, or it might be the one that absorbs your traffic spike. Halve a CPU request used by an HPA and you double the utilization it sees - the next change may be more replicas.
When should you change Kubernetes resource requests?
| What the metrics show | What it means for the request | Where the evidence is |
|---|---|---|
| Usage well below the request, steady | Reduction candidate | 7d CPU P95 / memory max vs resources.requests |
| Usage above the request | Increase candidate - the workload relies on capacity the scheduler has not reserved for it | 7d CPU P95 / memory max vs resources.requests |
| No request set | Add one. Without a memory request, any memory use exceeds the reservation and raises eviction risk under memory pressure | resources.requests absent |
| CPU P99 far above P95 | Bursty. Lowering the request can leave too little CPU during contention | quantile_over_time(0.99, …) vs 0.95 |
| CFS throttling | The limit is already binding. Fix the limit first | container_cpu_cfs_throttled_periods_total |
| OOMKill inside the window | Do not lower memory, whatever the average says | kube_pod_container_status_last_terminated_reason |
| An HPA targets utilization of this resource | The request is the denominator for scaling | spec.metrics[].resource.target.averageUtilization |
| Under ~6 hours of history | Radar withholds the recommendation | sample count vs window |
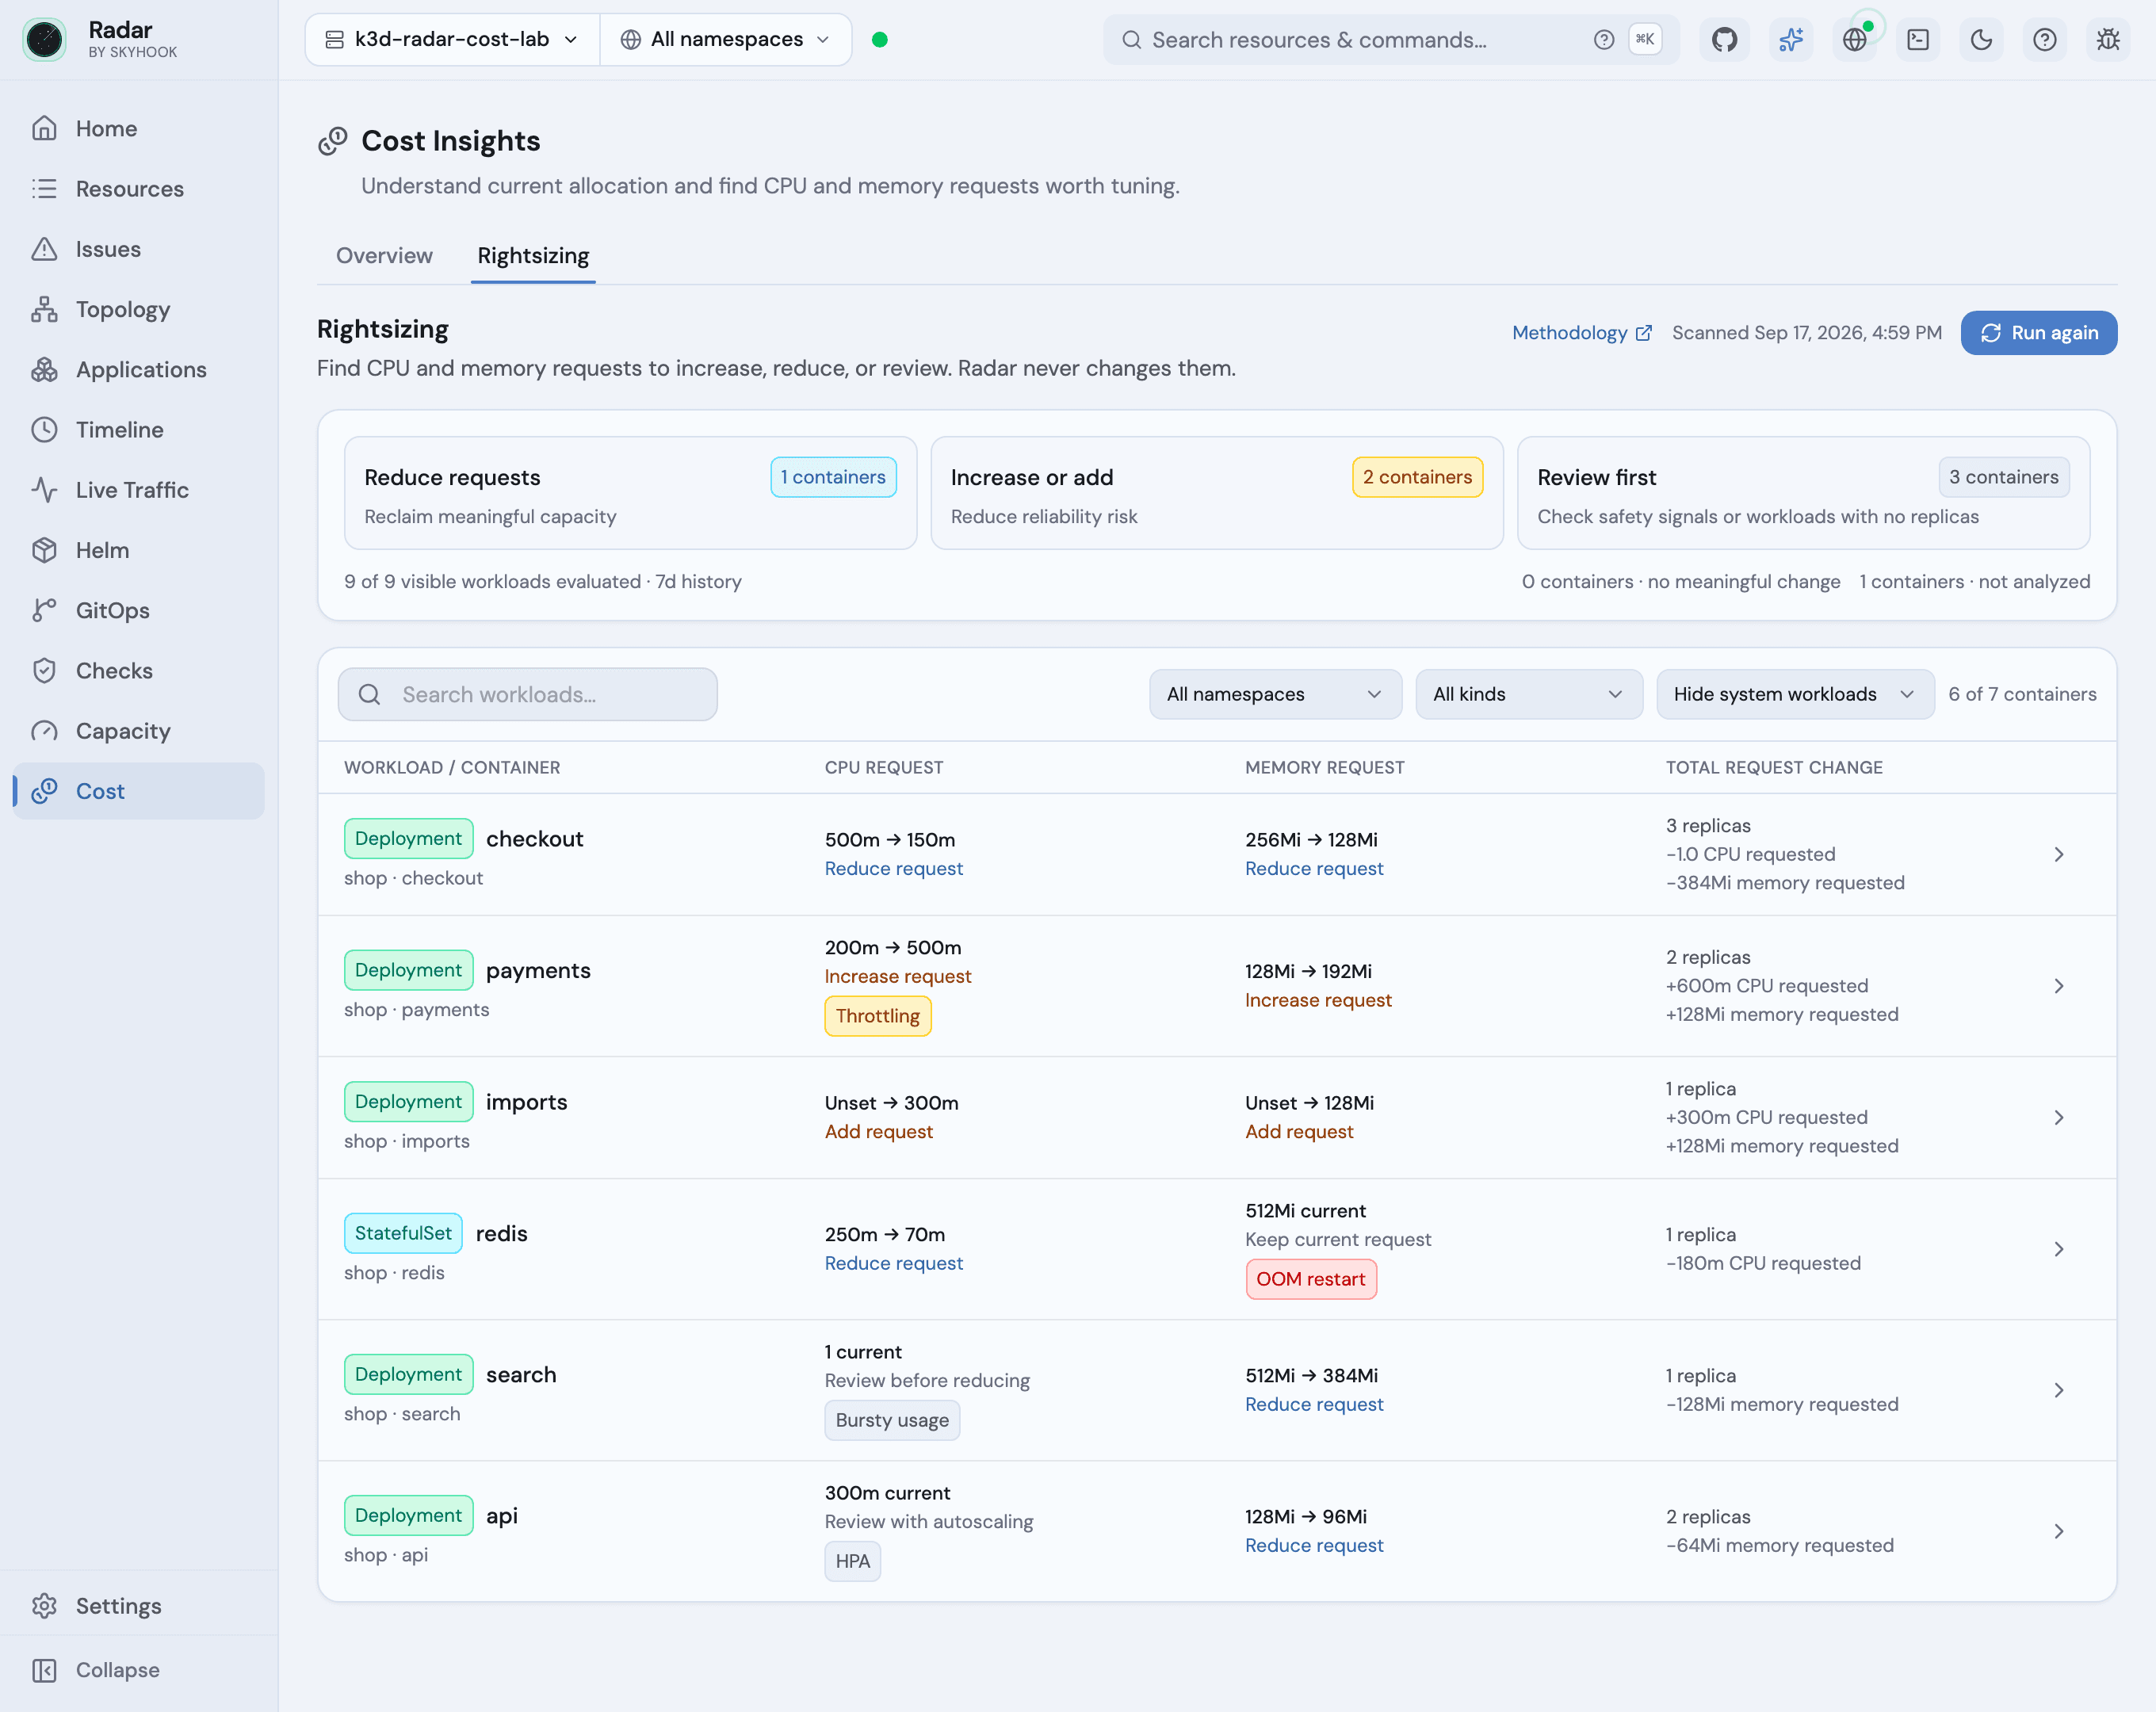
The screenshots below use Radar v1.14.1 on a demo cluster with synthetic usage history. Radar is the open-source Kubernetes UI we maintain. Its Cost view has two tabs: Overview for allocated workload cost, Rightsizing for per-container request guidance. The same reasoning applies whichever tool you use to gather it. Missing requests and utilization far below or above the request also appear as cluster audit findings inline on each resource.
How do you right-size Kubernetes CPU and memory requests?
To right-size Kubernetes requests, measure CPU and memory over a full traffic cycle, choose a statistic for each resource, add headroom, and check autoscaling and restart history before reducing. Radar uses CPU P95 and the maximum observed memory working set, with 15% headroom and staged reductions.
Radar uses a 7-day window sampled every 5 minutes, which gives 2,016 possible observations per container. It reads cAdvisor and kube-state-metrics series from any PromQL-compatible backend - Prometheus, VictoriaMetrics, Thanos or Mimir. This query measures CPU demand for the checkout Deployment in shop:
# Run against metrics from one cluster; add your cluster label if the backend holds several.
quantile_over_time(0.95, (
  max by (container) (
    rate(container_cpu_usage_seconds_total{namespace="shop",container!="",container!="POD"}[5m])
    * on (namespace,pod) group_left() (
      label_replace(
        max by (namespace,pod,owner_name) (
          kube_pod_owner{namespace="shop",owner_kind="ReplicaSet",owner_is_controller="true"}
        ),
        "replicaset", "$1", "owner_name", "(.*)"
      )
      * on (namespace,replicaset) group_left()
      max by (namespace,replicaset) (
        kube_replicaset_owner{namespace="shop",owner_kind="Deployment",owner_name="checkout",owner_is_controller="true"}
      )
    )
  )
)[7d:5m])
Memory is the same shape with max_over_time over container_memory_working_set_bytes, for reasons in the next section.
The ownership join restricts max by (container) to checkout's replicas. At each historical step, kube_pod_owner links a pod to its ReplicaSet and kube_replicaset_owner links that ReplicaSet to the Deployment. That includes pods replaced by earlier rollouts. A query filtered to only the pods running now misses those samples. Without retained ownership series, Radar's single-workload view falls back to those current pods, at lower confidence.
Rightsizing covers Deployments, StatefulSets and DaemonSets. Recommendations are per container in the pod template, which includes native sidecars (init containers with restartPolicy: Always, GA since 1.33) and excludes init containers that run to completion.
P95 or max: which statistic to size CPU and memory on
Kubernetes CPU and memory requests need different statistics because CPU contention slows a process down, while memory exhaustion can kill it.
CPU is compressible. The request is a scheduling reservation and a share weight, not a ceiling. A container that wants more than it requested gets it while the node is idle, and is squeezed back toward its share when the node is busy. Nothing kills it - the ceiling is the limit, and that is what CPU throttling enforces. Sizing CPU on the maximum therefore reserves the single worst 5-minute interval of the week until you change the request, which is why Radar sizes on P95.
Memory is not compressible. Exceed the limit and the kernel kills the container. There is no graceful degradation to trade against, so the statistic is the highest working set observed in the window, not a percentile of it.
The Vertical Pod Autoscaler recommender targets the 90th percentile for both CPU and memory (--target-cpu-percentile and --target-memory-percentile, both 0.9), from decaying histograms with a 24-hour half-life - memory from eight daily peak intervals, CPU from its own weighted usage samples. A P90 memory target can discount rare peaks; a max target keeps them. Neither is wrong, but they give different numbers for the same workload.
How much headroom should a Kubernetes request have?
Radar adds 15% to the observed demand, then applies a floor (10m CPU, 64Mi memory) and rounds up to a value on a human-readable ladder - 10m steps below 100m, 50m steps below a core, and 64/96/128/192/256/384/512Mi for memory.
15% is also VPA's default safety margin (--recommendation-margin-fraction, default 0.15). Rounding changes the final headroom: 90m plus 15% is 103.5m, but Radar's CPU ladder rounds that to 150m.
Why "reclaim 60%" is the wrong first step
The demo workload checkout peaked at 75Mi against a 256Mi memory request. Demand plus 15% headroom is 86.25Mi, which rounds up the ladder to a demand-based target of 96Mi. Radar recommends 128Mi, and says why:
Memory peaked at 75Mi during the measured period. Full 7-day history. Demand-based target: 96Mi. Radar suggests 128Mi as a conservative next step; observe another full window before reducing further.
Reductions are floored at half the current request (a quarter, for CPU requests between 100m and a core). The demand-based target is still shown, because hiding it would hide the actual measurement - but the number being proposed is a step, not a destination. Seven days of history is evidence about seven days, and cutting a request by 62% on that basis assumes the next seven look like the last seven. Run the window again after the change and the next step is available.
Can you right-size a workload managed by an HPA?
Changing a Kubernetes request also changes HPA scaling if the HPA uses utilization as its target.
A HorizontalPodAutoscaler with a Resource metric and a Utilization target scales on usage divided by the request. The request is the denominator. Halve it and every pod's reported utilization doubles, which can trigger a scale-out - converting a vertical over-provision into a horizontal one and handing back some or all of the reduction you just booked. An HPA targeting raw usage (AverageValue) does not use the request as its denominator.
So when an HPA targets CPU or memory utilization, Radar shows the current request and the observed usage but withholds the recommendation, labelled Review with autoscaling. The api row in the screenshot is this case: CPU is HPA-managed and gets no number, while memory - which that HPA does not target - is still recommended down from 128Mi to 96Mi.
A namespace-scoped HPA informer returns an empty list for namespaces it does not watch, with no error. Treating that as "no autoscaler here" produces a confident reduction for a workload that is autoscaled. When Radar's check cannot cover the namespace, the reduction is withheld and the row says the autoscaling status could not be verified.
Why you should not lower a memory request after an OOMKill
The cgroup boundary the kernel enforces is the memory limit, not the request - but an OOMKill still says this workload's memory numbers are not yet understood, and a usage percentile cannot see it. The working set of a container killed at its ceiling looks lower in the metrics afterwards, because the process that was using the memory is gone.
The redis row shows the result: 512Mi requested, 105Mi peak, and no recommendation.
Memory peaked at 105Mi during the measured period. Full 7-day history. A recent out-of-memory restart makes a lower memory request unsafe to suggest.
Radar reads this two ways: kube_pod_container_status_last_terminated_reason across the 7-day window, and the live pods' lastState.terminated.reason for current ones. That first series is a gauge of the most recent termination reason rather than an event log, so it catches an OOMKill that was still the last reason when a scrape landed - most of them, and not all of them. As with the HPA check, if the restart history cannot be read at all, memory reductions are withheld rather than issued blind.
VPA handles the same signal in the opposite direction. Its recommender records an OOMKill as an artificial memory sample, raised by at least 20% or 100Mi above the greater of the request and the recent memory peak (--oom-bump-up-ratio 1.2). That sample feeds the next recommendation. Radar withholds a reduction and leaves the memory investigation to you.
Bursty CPU and CFS throttling: two reasons not to cut
Bursty usage and CPU limit throttling are two reasons to review a CPU request before reducing it.
Burstiness. A workload whose P99 sits far above its P95 spends much of the window using little CPU and a small fraction of it working hard. Lowering its request does not cap that spike, but it reduces the container's share when the node is busy - exactly when the spike may need it. Radar flags a container as bursty when P99 exceeds P95 by at least 50m and is at least three times P95 - both conditions, so a workload that idles at 1m and peaks at 4m is not flagged for a 3x ratio that represents nothing. The demo's search workload has a 1-core request against a 120m P95, but a P99 near 900m, so the row reads Review before reducing with a Bursty usage badge instead of a number.
Throttling. rate(container_cpu_cfs_throttled_periods_total[5m]) over rate(container_cpu_cfs_periods_total[5m]) gives the fraction of scheduling periods in which the kernel cut the container off at its limit; Radar takes the worst such ratio in the window. It treats 10% as the line: above that the limit is already binding, and the request is not the first thing to change. payments carries a Throttling badge alongside its increase, because a container that is both throttled and under-requested has two separate problems.
How much history does a rightsizing recommendation need?
Radar needs 72 samples - six hours - before it will classify a container at all. Below that the row reads Not enough history and carries no verdict.
Coverage is then reported against the full window: 2,016 samples is a complete 7 days, and the expanded row says so ("Full 7-day history" above 95%, otherwise "4.2 days of usable history"). High confidence requires 80% coverage and ownership resolved through kube-state-metrics; a partial window still produces a recommendation, but one labelled for what it is.
A fresh cluster and a workload deployed three hours ago produce the same row: the current request, the usage so far, and no verdict. A workload deployed yesterday clears the 72-sample bar and does get a recommendation - carrying the confidence label its coverage earns, not the one a full window would.
Do you need OpenCost or Kubecost for rightsizing?
Kubernetes rightsizing needs usage history, not cost data. In Radar, the Rightsizing tab works without OpenCost or Kubecost; the Cost Overview needs one of them.
Radar reads two, and does not try to replace either:
- OpenCost via Prometheus (since February 25, 2026). The CNCF project's
container_cpu_allocationandcontainer_memory_allocation_bytesseries joined againstnode_cpu_hourly_costandnode_ram_hourly_cost. Auto-detected: if the series answer, the Cost view appears. - Kubecost 3's Aggregator API (since September 7, 2026, v1.13.0). For clusters already running Kubecost, Radar queries the allocation and asset APIs directly rather than re-deriving anything, and honours the currency the backend reports.
The Overview shows allocated workload cost by namespace, split into CPU and memory, plus the cost rate over time. Clicking through from a rightsizing recommendation opens that workload's own Cost tab. A smaller request frees scheduling capacity; it lowers the cloud bill only if your node autoscaler can consolidate or you remove capacity yourself.
How do you apply new CPU and memory requests?
In-place pod resize went GA in Kubernetes 1.35 (alpha since 1.27). It resizes running pods, through the Pod's resize subresource, and resizePolicy defaults to NotRequired for both CPU and memory - workloads that cannot shrink a live memory cgroup set RestartContainer for memory themselves.
What it does not do is edit your Deployment. These recommendations are per container in the pod template, and changing a template still rolls the workload. In-place resize applies a change to the pods running now; the template edit is what makes it stick.
Radar makes neither change - the Rightsizing tab says "Radar never changes them" in its own description. If you want something that acts, VPA's updater does; run VPA in Off mode and you get the recommender without the mutation, which is how Goldilocks uses it. Either way you install the CRDs and run the recommender in your cluster.
What this doesn't do
- It is not a cost allocation platform. Showback and chargeback are OpenCost's job; budgets, forecasting and cloud-bill reconciliation belong to the commercial platforms built on that data.
- It does not size limits, only requests. Throttling and OOM signals tell you a limit needs attention; the recommendation is always for
requests. - It does not touch nodes. Instance types, spot mix and bin-packing are a different problem - see Karpenter troubleshooting for the capacity side of it.
- It cannot see what has not happened yet. Seven days of history does not contain your quarterly close, and no statistic will invent it. If your load has a monthly shape, treat every reduction as the first of two steps.
Running it
Rightsizing reads a 7-day window from a PromQL-compatible backend, plus kube-state-metrics for ownership, and starts classifying once a container has six hours in it. The Cost Overview needs OpenCost or Kubecost. Radar itself installs nothing in the cluster - no agent, no CRD - it reads the services you already run.
Radar is open source under Apache-2.0 and ships as a single binary that runs on your laptop against your kubeconfig:
brew install skyhook-io/tap/radar
radar
Then open the Cost view, or star it on GitHub. If it finds no cost source it says so, and the Rightsizing tab keeps working without one.
Get the next issue in your inbox
Kubernetes deep-dives, new Radar releases, and what we learned shipping them.
About one email a month. No sales sequences. Unsubscribe anytime.
Keep reading
Kubernetes 1.37 Breaking Changes: What to Check Before You Upgrade
Kubernetes 1.37 removes 25 feature gates, an alpha scheduling API, and 18 kubelet flags, and starts the nftables transition. What breaks, and how to check your cluster.
Give Your Agent Context Before You Buy an AI SRE
We ran the same agent and model on 50 live Kubernetes faults. With read-only cluster context it reached the answer about three times faster, and was slightly more accurate. Here's what it did without that context, and how to run the same test before you buy an AI SRE.
Kubernetes 1.34 End of Life: What Actually Happens on EKS, GKE, and AKS
Kubernetes 1.34 reaches end of life on October 27, 2026. What that date and the EKS, GKE, and AKS deadlines around it actually do to your clusters, and what to check.