> ## Documentation Index
> Fetch the complete documentation index at: https://radarhq.io/docs/llms.txt
> Use this file to discover all available pages before exploring further.
# Exec & port-forward
> Pod terminal, debug containers, port forwarding, and a local terminal pane - all gated by RBAC and disable-able per install.
Radar can drop you into a pod, attach a debug container, forward a port to your laptop, or open a local terminal. Each is gated by RBAC and can be disabled per-install.
## Pod terminal
Click **Exec** on any pod (or a container row). Radar opens a WebSocket-backed terminal in the side panel, falling back to SPDY automatically - so exec, attach, and copy work behind gateways (like the GKE Connect Gateway) that block SPDY.
* Default shell cascade: `bash -il` → `ash` → `sh`. Override with `--pod-shell-default 'bash -l'`.
* Multiple terminals can be open simultaneously; they're persisted in the URL so you can share or reload.
* Explicit copy and platform-aware paste keep the terminal usable across browsers and operating systems.
* Closing the panel terminates the exec session immediately.
**RBAC:** needs `pods/exec` on the namespace. Disabled by default in the chart - opt in with `rbac.podExec: true`. Per-user installs (proxy / OIDC auth) inherit each user's exec permissions.
**Disable cluster-wide** with `--disable-exec`.
## Debug containers
For pods running minimal images (distroless, scratch), Radar can inject an [ephemeral debug container](https://kubernetes.io/docs/tasks/debug/debug-application/debug-running-pod/#ephemeral-container) with a full shell. Click **Debug** instead of **Exec** on the pod.
The debug container shares the target pod's PID and network namespace by default - so `ps`, `netstat`, and friends see what the target sees.
**Image:** defaults to `busybox:latest`, and the same image is used for node debug pods. In air-gapped or private-registry clusters where that can't be pulled, point it at a mirror with `--debug-image` (standalone) or the `debug.image` Helm value. Radar doesn't attach image-pull secrets to debug containers or pods - ephemeral containers inherit the target pod's, and node debug pods rely on the `default` namespace's ServiceAccount / node registry config - so the image must be pullable without Radar supplying credentials.
**RBAC:** needs `pods/ephemeralcontainers` patch. Same on-by-default behavior as `podExec`.
## Port forwarding
Forward any pod or service port to your local machine. Click the port number in the resource row → **Forward**.
* The list of active forwards is in the bottom-right tray. Click any one to copy the local URL.
* SSE-pushed status keeps the tray live across pages.
* Forwards survive page navigation but stop when you close Radar.
* If a forward fails (for example, the target pod was replaced), a **Retry** button re-resolves to a running pod in one click.
**RBAC:** needs `pods/portforward` on the namespace. Disabled by default in the chart - opt in with `rbac.portForward: true`.
**Live forwarding only works when Radar runs on your machine.** When Radar runs in-cluster or in Radar Cloud, the forward's listener would bind on the Radar pod - unreachable from your browser - so live port-forward is gated off. Instead, every port shows a copy-paste **`kubectl port-forward`** command you can run with your own `kubectl` and cluster credentials, and HTTP ports get a [Probe](#probe-a-service-endpoint) button that works without any local setup.
API:
```http theme={null}
GET /api/portforwards # list
POST /api/portforwards # create
DELETE /api/portforwards/{id} # stop
GET /api/portforwards/available/{type}/{namespace}/{name} # which ports a target exposes
```
## Probe a Service endpoint
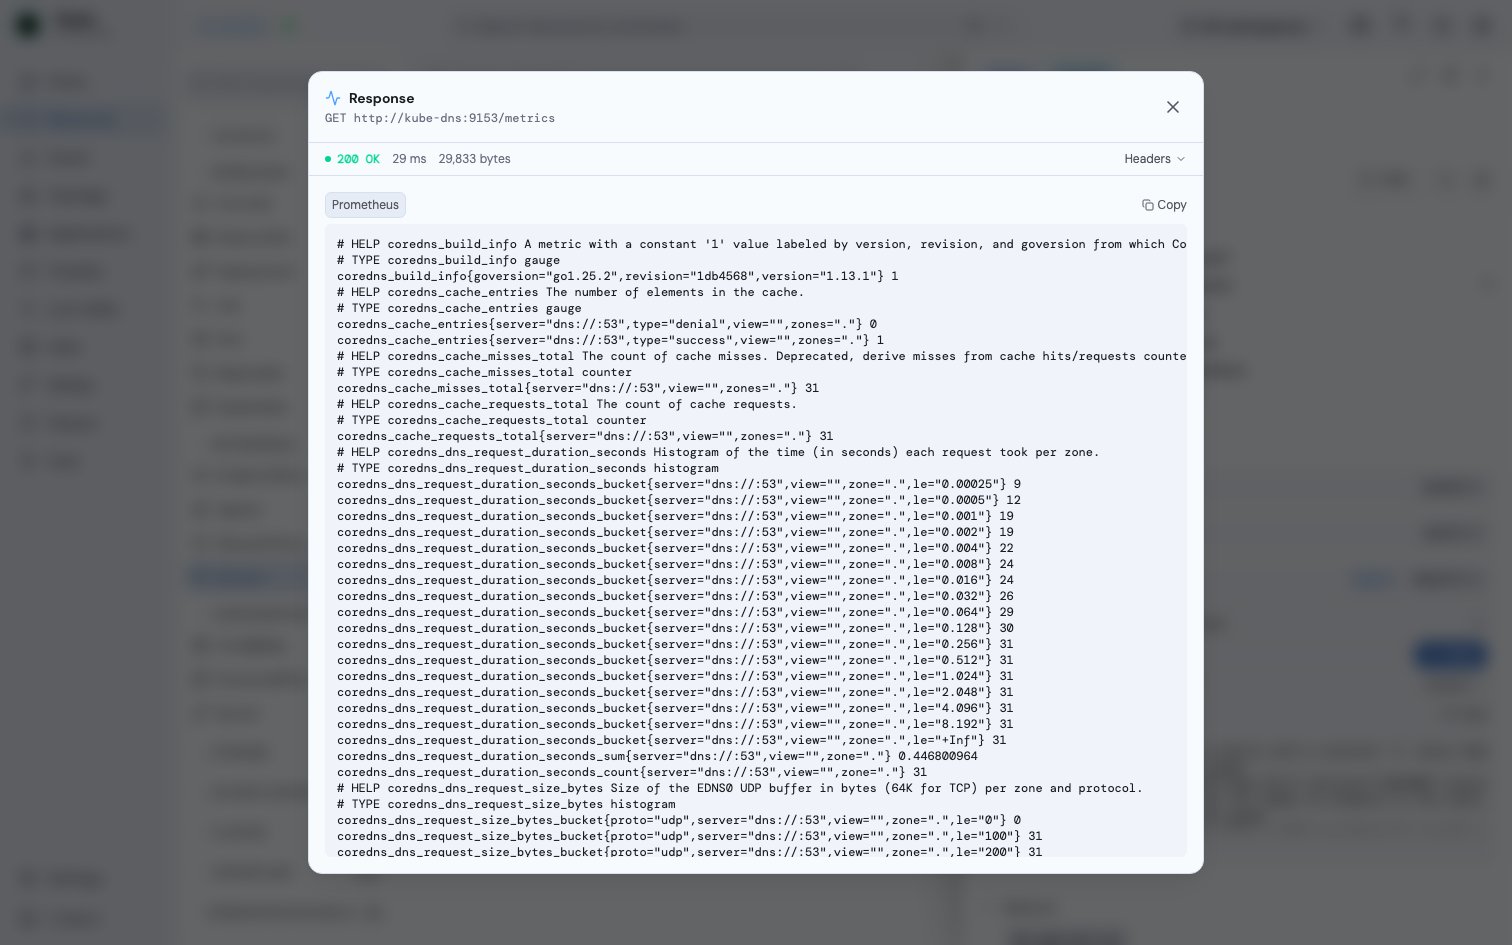
When a live port-forward isn't possible (Radar Cloud / in-cluster), you can still answer "is this endpoint alive, and what does it return?" without leaving the browser. On an HTTP-ish Service port, click **Probe** (or **Curl**): Radar issues a single `GET` to the Service **from inside the cluster** and shows you the response - status, latency, byte count, headers, and a capped body.
 * **GET-only**, 10s timeout, 512 KiB body cap, and redirects are **not** followed (a probed workload can't bounce the request elsewhere or be used to leak credentials).
* Only HTTP-ish TCP ports get the button (a heuristic over `appProtocol`, port name, and common HTTP port numbers); UDP and non-HTTP ports don't.
* Edit the scheme and path before sending; the full response opens in its own dialog for large bodies like `/metrics`.
**RBAC:** authorized by a SubjectAccessReview for `get` on the Service's `services/proxy` subresource, using your identity - so Probe never reaches an endpoint you couldn't reach yourself. No extra capability flag; a `403` surfaces in the response. (Local, no-auth installs are always allowed.)
API:
```http theme={null}
POST /api/probe/service # GET a Service via the apiserver services/proxy subresource
POST /api/curl/service # in-cluster direct dial to a Service (no credentials sent to the workload)
```
## Local terminal
Radar can open a terminal on the **machine running Radar** (your laptop for local installs, or the Radar pod for in-cluster installs). Useful for ad-hoc `kubectl` / `helm` commands without leaving the UI.
* Local installs: full shell access on your laptop. Honors your \$SHELL and login config.
* In-cluster installs: access to the Radar pod's shell. Combined with the pod's ServiceAccount permissions, that's effectively a `kubectl` session.
**Disable** with `--disable-local-terminal`. For in-cluster shared deployments where you don't want operators having a shell on the Radar pod, set this and `rbac.podExec: false`.
## Restricted-permission preview
If you want to *preview* what a restricted operator would see, run with `--disable-helm-write` / `--disable-exec` / `--disable-local-terminal` to mask those features in the UI without changing your real RBAC.
## See also
* [Authentication](/docs/configuration/authentication) - per-user RBAC via impersonation.
* [In-cluster deployment](/docs/configuration/in-cluster) - the chart's RBAC opt-ins.
* [CLI flags](/docs/configuration/cli) - the `--disable-*` switches and `--pod-shell-default`.
* **GET-only**, 10s timeout, 512 KiB body cap, and redirects are **not** followed (a probed workload can't bounce the request elsewhere or be used to leak credentials).
* Only HTTP-ish TCP ports get the button (a heuristic over `appProtocol`, port name, and common HTTP port numbers); UDP and non-HTTP ports don't.
* Edit the scheme and path before sending; the full response opens in its own dialog for large bodies like `/metrics`.
**RBAC:** authorized by a SubjectAccessReview for `get` on the Service's `services/proxy` subresource, using your identity - so Probe never reaches an endpoint you couldn't reach yourself. No extra capability flag; a `403` surfaces in the response. (Local, no-auth installs are always allowed.)
API:
```http theme={null}
POST /api/probe/service # GET a Service via the apiserver services/proxy subresource
POST /api/curl/service # in-cluster direct dial to a Service (no credentials sent to the workload)
```
## Local terminal
Radar can open a terminal on the **machine running Radar** (your laptop for local installs, or the Radar pod for in-cluster installs). Useful for ad-hoc `kubectl` / `helm` commands without leaving the UI.
* Local installs: full shell access on your laptop. Honors your \$SHELL and login config.
* In-cluster installs: access to the Radar pod's shell. Combined with the pod's ServiceAccount permissions, that's effectively a `kubectl` session.
**Disable** with `--disable-local-terminal`. For in-cluster shared deployments where you don't want operators having a shell on the Radar pod, set this and `rbac.podExec: false`.
## Restricted-permission preview
If you want to *preview* what a restricted operator would see, run with `--disable-helm-write` / `--disable-exec` / `--disable-local-terminal` to mask those features in the UI without changing your real RBAC.
## See also
* [Authentication](/docs/configuration/authentication) - per-user RBAC via impersonation.
* [In-cluster deployment](/docs/configuration/in-cluster) - the chart's RBAC opt-ins.
* [CLI flags](/docs/configuration/cli) - the `--disable-*` switches and `--pod-shell-default`.